0 Introduction
0.1 Background and motivation
Owing to technological advances and reduced costs,photovoltaic (PV) power generation technology has developed rapidly and become an effective means of realizing the transition to the sustainable energy sector.According to the International Energy Agency estimates,the share of PV power generation in the global electricity generation will reach 16% by 2030 [1].China is the world's largest producer of PV equipment,with abundant solar resources.The installed PV capacity in China has risen sharply,reaching 306 GW by 2021 [2].Moreover,the Chinese government’s carbon emissions peak and carbon neutrality plans bring unprecedented opportunities to develop the PV industry [3].Since no additional land is required,rooftops are considered suitable carriers for installing PV arrays [4].In June 2021,the “Notice on Submitting the Pilot Project Schemes for the Development of Distributed Photovoltaics on the Rooftops of the Entire County (District).” was issued by the National Energy Administration of China,reflecting the Chinese government’s focus on the deployment of rooftop PV [5].
Solar irradiation,rooftop area,energy demand,and electricity price vary significantly across different regions of China.Therefore,it is necessary to estimate the local rooftop PV generation potential and the economic returns when the government or enterprises make development plans for rooftop PV [6].Solar irradiation data and rooftop information form the foundation for estimating rooftop PV generation potential.Solar irradiation data can be easily obtained from several weather databases.However,owing to the lack of detailed and publicly available rooftop data,extracting regional rooftop information becomes a technical difficulty when estimating the regional rooftop PV potential.To this end,a comprehensive framework for estimating the regional rooftop PV potential is proposed in this paper,and the rooftop information is extracted from Gao Fen-7 (GF7)satellite images.
0.2 Related works
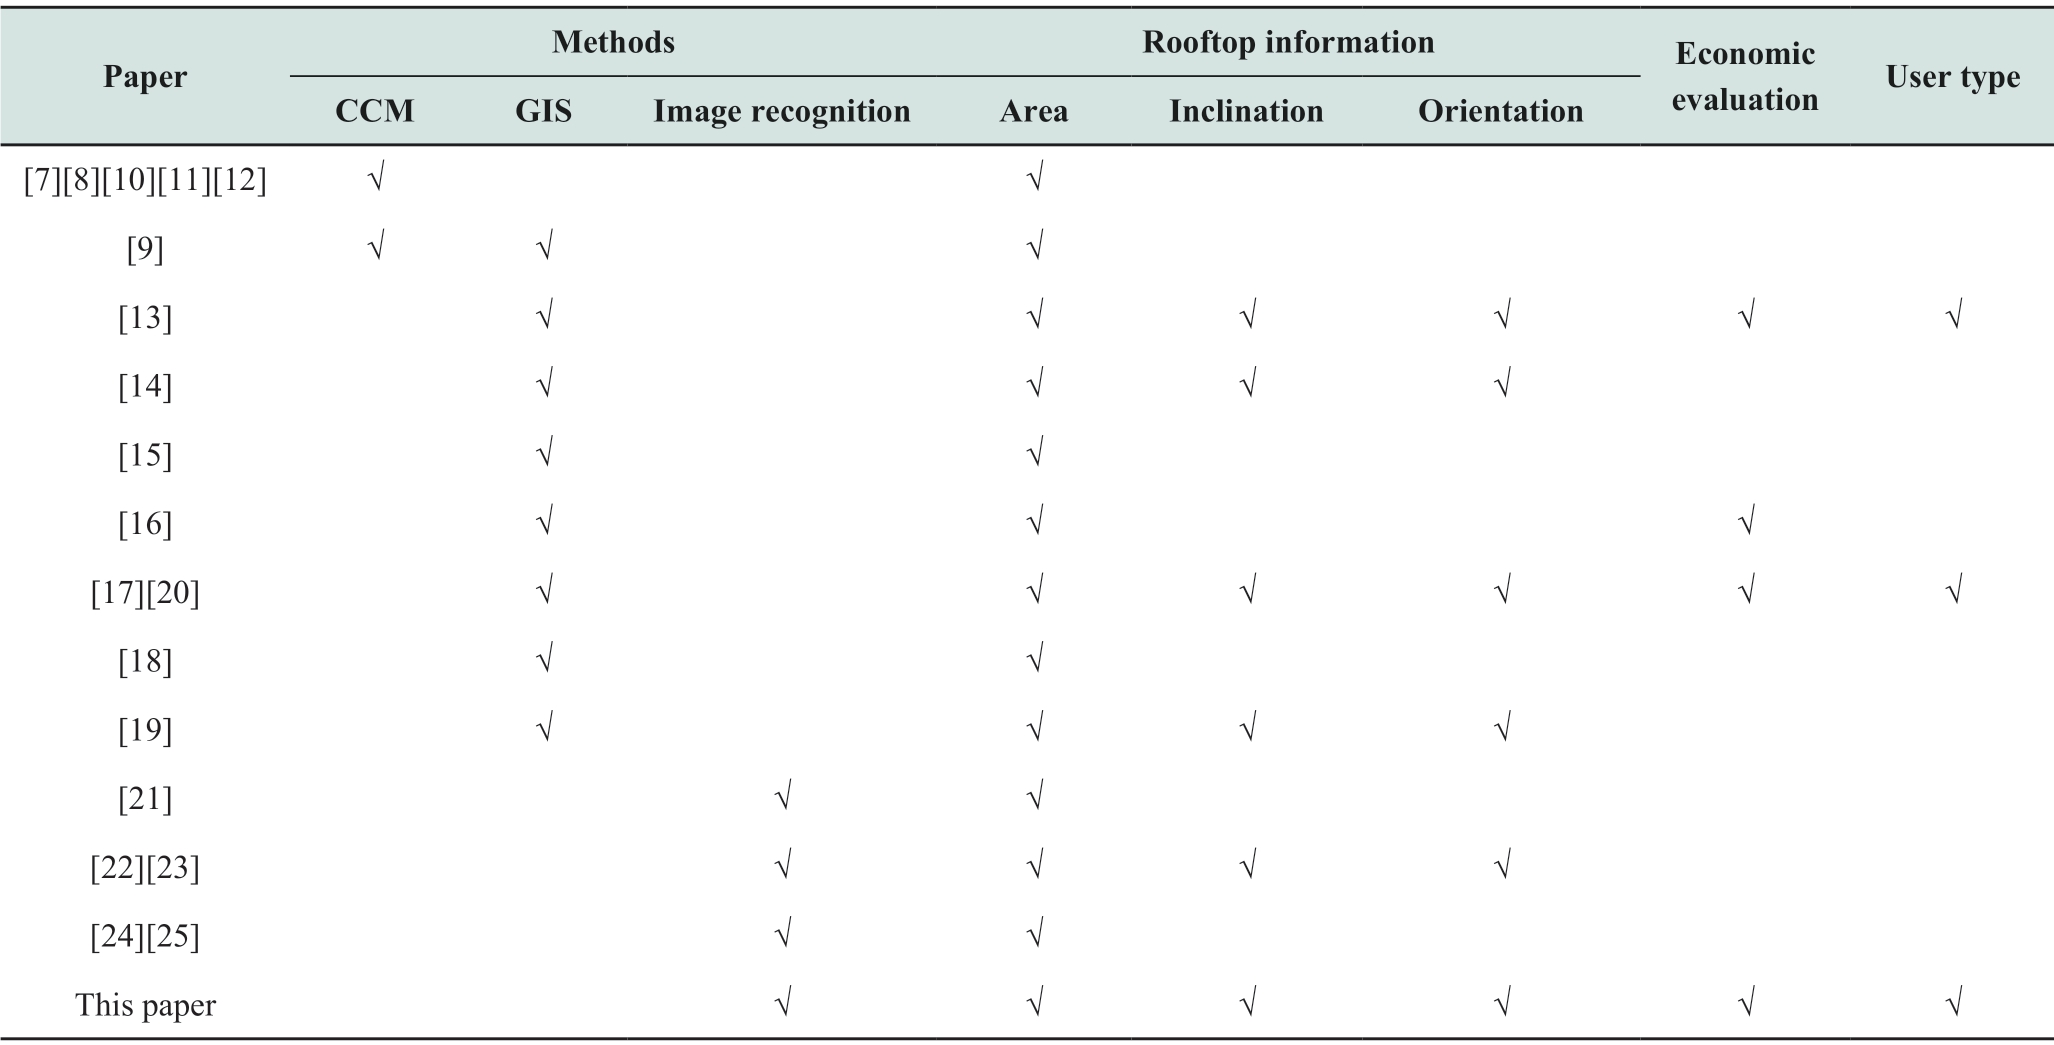
Considerable research efforts have been conducted to estimate the regional rooftop PV potential.The differences between these researches are mainly in data sources,extraction methods of roof information,and types of extraction results.The data sources,methods,and results are interrelated.In [7-12],the traditional correlation coefficient method (CCM),which leverages the relationships between rooftop information and statistical data,was used to obtain the information on rooftops with low calculation costs.Based on the population data,the correlation between population and rooftop area was used in [7]to calculate the rooftop area in European Union.Reference [8]investigated the rooftop PV potential in Geneva,Switzerland.It estimated the rooftop area by using the data on population,the number of buildings,and the rooftop footprint.To improve the rooftop area’s estimation accuracy,considering the research area’s characteristics,urban and industrial neighborhoods were classified into different types in [9]and[10],respectively,considering the building characteristics in the research area.Ref.[11]combined an evaluation of solar energy resources in Taiwan with the land use data obtained from the urban planning department.High-granularity land use data available in the public domain was used in [12]to estimate the values of the building footprint area ratio of Mumbai.In the traditional CCM,data sources are the statistics data of land use,population,or buildings.It is more suitable for regions with well-established statistics to estimate the PV potential of large-scale areas with lower accuracy.In addition,it is difficult to obtain the inclination and azimuth information of rooftops using the CCM.
In recent years,high-resolution remote sensing data combined with geographic information system (GIS)technology have been widely used for extracting building rooftops.A 3D urban massing model was constructed in [13]based on LiDAR data and GIS to simulate the PV generation potential of rooftops.In [14],the GIS platform was used to estimate the solar potential in an urban environment,and the influence of the building’s surroundings on its solar potential was analyzed.The highgranularity land use data available in the public domain and GIS-based sample satellite images were used in [15]to calculate the rooftop area of Mumbai.In [16],a GISbased framework for assessing the regional PV potential was developed.The PV potential of Fujian Province,China,was calculated as an example.A comprehensive GIS-based analysis framework for roof-mounted solar PV systems was developed in [17]to estimate the rooftop PV potential of Sweden.The technical potential of residential roofmounted PV in Germany was estimated in [18]based on GIS.In [19],suitable rooftop surfaces were identified using digital surface models and building footprints to estimate rooftop solar irradiation potential over large regions.However,when using the GIS-based 3D model to estimate the potential of rooftop PV,a large amount of three-dimensional data needs to be processed,which is labor-intensive and time-consuming [20].
Based on high-resolution satellite remote sensing images,image recognition technology can be employed to extract information on rooftops.In [21],high-resolution satellite images were used to estimate the rooftop PV potential at the urban scale,but only the area information of the rooftop was extracted.Ref.[22]classified the roofs into different types and extracted the information of different types of rooftops separately using satellite images.However,the economic efficiency of the rooftop PV was not considered.Support vector machine classification was employed in [23]to classify roof shapes based on satellite images.In [24]and [25],the deep learning method extracted the rooftop area from the satellite images.However,the inclination and azimuth of rooftops were not considered.The method based on satellite remote sensing images can extract regional rooftop information with high efficiency.
0.3 Objective and contributions
Previous studies on rooftop PV potential estimation often only focus on the acquisition of rooftop area information and lack consideration of the inclination and orientation information,which determine the installation manner of PV arrays on rooftops.In addition,there is a lack of evaluation and analysis of the economics of rooftop PV for different users.This study extracts the area,inclination,and azimuth information of regional rooftops by leveraging the threedimensional characteristics of GF-7 satellite images.To the authors’ knowledge,this is the first time GF7 satellite remote sensing images have been applied to the rooftop PV potential estimation field.Based on the information on regional rooftops,a comprehensive framework for estimating the regional rooftop PV potential is developed,containing the economic efficiency evaluation of the rooftop PV project for different users.The comparison of research content between this study and previous studies is shown in Table 1.
Table 1 Comparison of research content between this study and previous studies
The main contributions of this study are as follows.
(1) A complete framework for estimating the regional rooftop PV potential is developed.The framework includes extracting the regional rooftops’ information,calculating solar irradiance and PV generation potential,and conducting an economic efficiency evaluation.
(2) Using GF7 satellite image as the data source,the rooftop area,azimuth,and inclination information are extracted by the semantic segmentation network and normalized digital surface model (nDSM).Additionally,buildings are divided into commercial and industrial (C&I)and residential buildings using point of interest (POI) data.
(3) The method proposed in this study is applied to a regional area of the Da Xing district in Beijing.The information on rooftops in the area is extracted.The rooftop PV generation potential in the region is analyzed,and the economic efficiency evaluation of rooftop PV is evaluated.
The rest of this paper is organized as follows.The framework for regional rooftop PV potential estimation is described in Section 1.Section 2 specifies the methods used in each part of the framework.The data and results of the case study are discussed in Section 3.The conclusion is presented in Section 4.
1 Framework for regional rooftop PV potential estimation
As shown in Fig.1,the regional rooftop PV potential estimation framework proposed in this study consists of four parts:
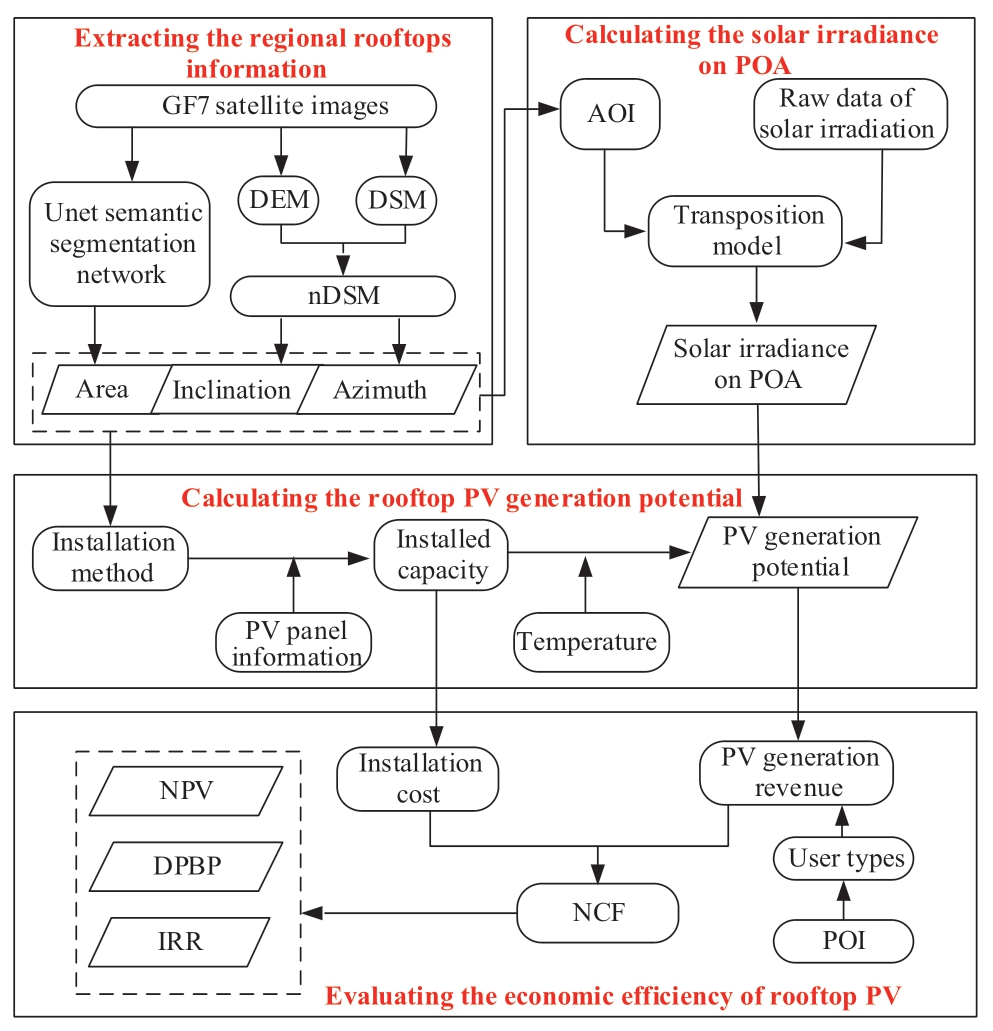
Fig.1 The framework for regional rooftop PV potential estimation
(1) Extracting the regional rooftop information
The information on rooftops,including area,inclination,and azimuth,is extracted based on GF7 satellite images in this part.Until now,seven satellites of the GF series,named GF1 to GF7,have been successfully launched by China.Among them,spatial resolutions of GF2,GF3,and GF7 are under 1 m.The GF7 satellite has the advantages of frontto-back stereo imaging capability and sub-meter spatial resolution in the same orbit.It can use the laser altimeter to obtain high-precision elevation information and improve the elevation accuracy of optical stereo images in uncontrolled conditions.Among the satellites launched,GF7 is one of the few satellites with a stereo mapping function,which can obtain the height of features,including buildings.First,to obtain the area of rooftops,the Unet semantic segmentation network is used to extract the outline of the building from GF7 satellite images.Then,using the stereoscopic feature of GF7 satellite images,the digital surface model(DSM) and digital elevation model (DEM) of the rooftops in the research region are established,and the nDSM can be obtained.Finally,based on the nDSM,rooftops’inclination and azimuth information can be calculated using the height information of the pixel points on the rooftops.The proposed algorithm requires remote sensing satellite imagery to identify the roof shape of the building and calculate the building height.Hence,the satellite that provides the data from the perspective of satellite parameters needs to meet two requirements: 1) the higher the panchromatic resolution,the better,and the satellite should preferably have a sub-meter resolution; 2) it should have a three-dimensional acquisition ability.In addition to the GF7 satellite,some foreign satellites meet these two requirements.The cost of obtaining images for foreign satellite data is much higher than that of GF7 satellites.Hence,GF7 has a certain irreplaceability for this applicable algorithm.
(2) Calculating the solar irradiance on plane-of-array (POA)
The solar irradiation on the POA is the foundation for calculating the power generation potential of the PV array and the raw data of solar irradiation,such as direct normal irradiation (DNI),diffuse horizontal irradiation (DHI),and global horizontal irradiation (GHI),are primarily for horizontal planes.Since the solar irradiation on the POA is affected by the inclination and azimuth of POAs,the raw data of solar irradiation cannot be used directly.
This part aims to calculate the solar irradiation on the POA based on the raw data of solar irradiation using the transposition model.First,the angle of incidence (AOI) of POA needs to be determined based on local geographical and rooftop information.Then,the local raw solar irradiance data are input.Finally,the isotropic sky translocation model is used in this study to calculate the solar irradiance on POA.
(3) Calculating the rooftop PV generation potential
To calculate the rooftop PV generation potential in the study area,it is first necessary to determine the installed capacity of rooftop PV related to the area and installation methods.In terms of area,some structures on rooftops,such as skylights and parapet walls,will reduce the installable area of PV.Hence,the rooftop area extracted from part (1)must be discounted [26].Economics and safety need to be considered in terms of installation methods.Different installation methods are used for different types of rooftops.The rooftops are divided into flat and sloped rooftops.Specifically,rooftops with less than 5° inclinations are considered flat rooftops,and those with inclinations less than 5° are considered sloped rooftops.PV is not installed on roofs with more than 45° inclination [27]for safety reasons.A rooftop with less than 5° inclination can be considered a flat rooftop.The PV arrays are installed at the optimal inclination angle facing south to maximize the PV generation per unit area of flat rooftops.PV panels are generally installed in a lay-flat manner on sloped rooftops considering the impact of wind loads and fixing costs.In addition,due to the short duration of solar irradiance,PV panels are not installed on sloped rooftops facing northeast,north,and northwest directions.
Based on the installation method described above,the installed capacity of rooftop PV can be obtained based on the information on PV panels.Since the generation efficiency of PV cells is greatly affected by temperature,the generation potential of rooftop PV can be calculated using the solar irradiance on POA and local temperature information.
(4) Evaluating the economic efficiency of rooftop PV
Since there are different electricity policies for different users,to improve the accuracy of economic efficiency evaluation,building types in the study region are distinguished into C&I and residential buildings by using the POI data.This study obtains the POI data representing the building type in the experimental area on the official website of Gao De Maps and converts the coordinate system of the POI data to that used by GF7.In the same coordinate system,the POI data of the area where the building vector is located represents the building type.
Based on the PV generation potential,the PV generation revenue for C&I and residential customers can be obtained separately [28].The installation cost can also be obtained from the installed capacity.Subsequently,the net cash flow(NCF) can be calculated.Net present value (NPV),dynamic payback period (DPBP),and internal rate of return (IRR) are three indicators used in this study to evaluate the economic efficiency of the rooftop PV [29].
2 Method
2.1 Method of extracting the regional rooftop information
In this study,three-dimensional image pairs obtained from the GF7 satellite are used as the data source to extract the area,inclination,and azimuth information of the rooftops in the research area.2.1.1 Method of extracting area information
Unet semantic segmentation network is used to extract rooftop contours.First,due to the limited number of data samples from the GF7,we use GF7 satellite images and Google images together to complete the sample annotation.Then,the sample set is created by data format conversion,data chunking,and image slicing of the images.Figure 2 shows an example of the sample set.

Fig.2 GF7 stereo image pair in the experimental area
The size of the image set is 384×384,including 2694 images in the training set,582 images in the verification set,and 136 images in the test set.Unet has been referred to as an effective structure in image segmentation tasks.Given an image in which each pixel is grouped into a specific category,Unet architecture can hierarchically extract lowlevel features and recombine them into higher-level features in the encoder.Simultaneously,it can perform the elementwise classification from multiple features in the decoder.In the Unet semantic segmentation network method,the training number is set to 80000,the image batch size is 4,and the initial learning rate is 0.003.After the training is completed,the recall rate tested on the test set is 84.3%,the precision is 82.5%,and the F1 value is 83.4%.The image prediction effect is shown in Fig.3.
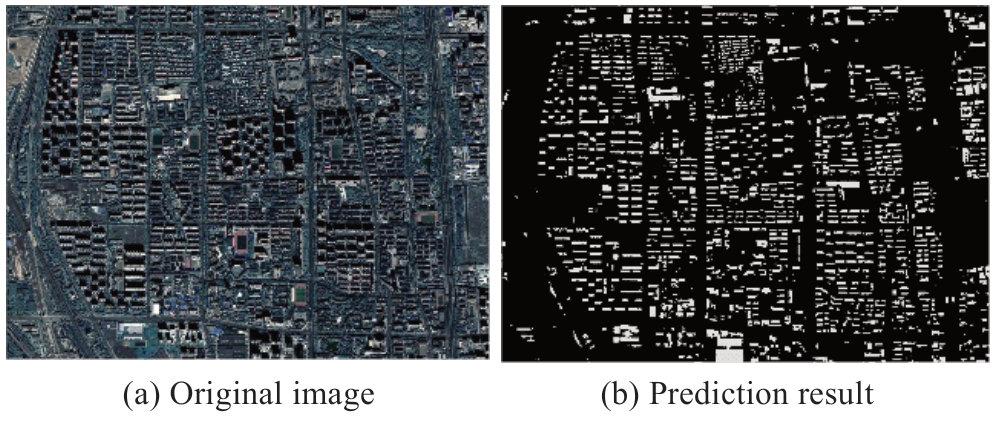
Fig.3 Prediction map of the building outline
After the experiment in Daxing district,Beijing,to verify the universality and accuracy of the roof information extraction method,97 buildings in Pinggu district,Beijing,are trained using the Unet semantic segmentation network.After training,the recall rate tested on the test set is 81.6%,the precision is 83.9%,and the F1 value is 82.7%.
The spatial resolution of GF7 is 1 m × 1 m,and one pixel records the attributes of one square meter of land.Therefore,each extracted building is traversed to obtain the number of pixels in each building vector.The number of pixels is numerically equal to the size of the building area.
2.1.2 Method of extracting inclination and azimuth information
In this study,we use the environment for visualizing images (ENVI) to process the GF7 satellite images to obtain DSM and DEM of rooftops.ENVI is the flagship of Exelis Visual Information Solutions.ENVI is the ideal software for the visualization,analysis,and presentation of all types of digital imagery.Then,DSM and DEM are input into GIS to get nDSM,as shown in Fig.4.Each pixel in nDSM records the height information of the corresponding rooftop relative to the ground.This height information is used to calculate the inclination and azimuth information of the rooftop.

Fig.4 DSM,DEM,and nDSM (left to right)
For pixel point e on a rooftop,the inclination and azimuth can be calculated from the height relationship between pixel point e and the surrounding pixels.A schematic of pixel e and its surrounding pixels is presented in Fig.5.

Fig.5 Pixel point e and its neighboring points
The inclination of pixel e is calculated as follows:
where dz /dx and dz /dy represent the rate of change of the height value in the x and y directions in the space coordinate system,respectively.The coefficient 57.3 is used for radian to angle value conversion.dz /dx and dz /dy are determined by the height value of the surrounding pixels of pixel e.

where a,b,c,d,f,g,h,i represent the height values of the corresponding pixel.
The azimuth of pixel e can be calculated by the following equation:
Then,the inclination and azimuth information of the rooftop are obtained by calculating the average value of the inclination and azimuth information of all pixels contained in the rooftop:
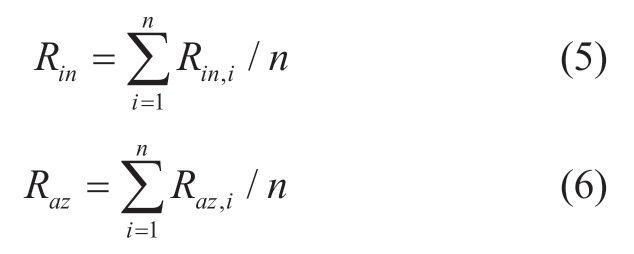
where Rin and Raz represent the inclination and azimuth of the rooftop,respectively.Rin,i and Raz,i represent the inclination and azimuth of the i-th pixel in the rooftop,respectively,and n is the total number of pixels contained in the rooftop.
2.2 Method of calculating the solar irradiance on POA
The AOI of the solar ray to the POA is calculated as follows [30]:

where β is the inclination angle of POA,AZs is the zenith angle of the sun,AZm is the azimuth angle of POA(0° toward the north and 90° to the east),and Zs is the azimuth angle of the sun.For flat rooftops,β is the optimal inclination angle of PV arrays,and AZm equals 180°,indicating that PV arrays are facing due south.For sloped rooftops,PV arrays are installed in a lay-flat manner.Thus,β and AZm are equal to the inclination and azimuth angle of the sloped rooftop.
The solar irradiance on POA comprises beam,skydiffuse,and ground-reflected irradiations [31].The direct irradiation is determined by DNI and AOI:
where GDNI is the DNI,and Gb is the beam irradiation.The sky-diffuse irradiation is calculated by the isotropic sky model [32]:
where GDHI is the DHI,and Gd,sky represents the sky-diffuse irradiation.The calculation method of ground-reflected irradiation is as follows:
where GGHI is the GHI,ρ is the ground reflectivity,equal to 0.2,and Gd,ground is the ground reflected irradiation.
Hence,the solar irradiation on the POA denoted by G can be obtained by adding the above three items:
2.3 Method of calculating the rooftop PV generation potential
2.3.1 Flat rooftop
The optimal inclination angle of the flat rooftop can be calculated as follows:
where βopi is the optimal inclination angle,which can be obtained by the traversal search method.
To avoid mutual shielding between PV modules,a gap should be left between the two rows of PV arrays on flat rooftops,as shown in Fig.6.In this study,the minimum spacing between the arrays is designed based on the principle of no obstruction between 0900 to 1530 h in the winter solstice [33].
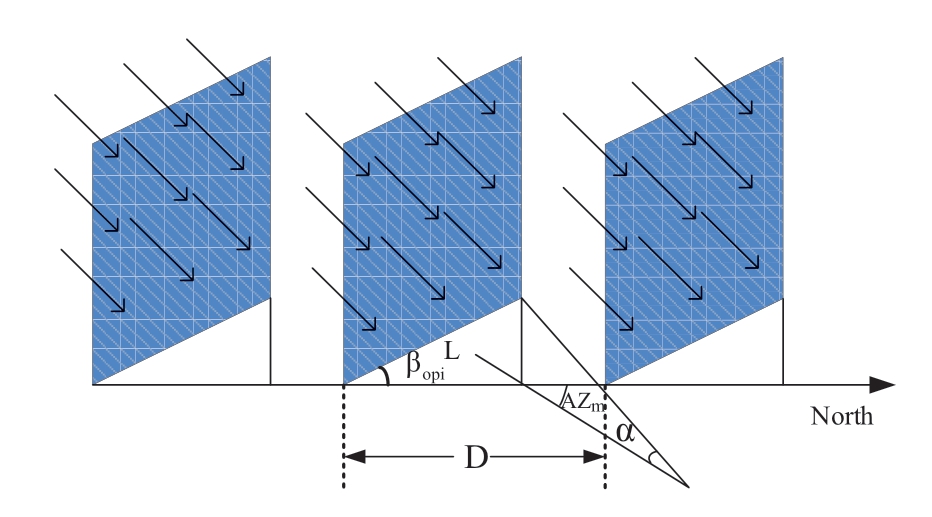
Fig.6 Schematic diagram of the flat rooftop PV array
In this study,the packing factor (PF) is defined as the ratio of the installed PV panel area to the extracted building PV installable area [34].The PF of the flat rooftops can be calculated by the following equation:

where PFhor is the PF of flat rooftops,κhor is the installable area discount factor of flat rooftops,L is the length of the PV panels,D is the spacing between the PV panels,and α is the solar altitude angle.
The calculation method of the installed capacity of PV arrays on the flat rooftops is as follows:
where Caphor is the installed PV capacity of the flat rooftop,Shor is the flat rooftop area,PSTC and Sp are the rated output power and area of the PV panel,respectively.
The PV generation potential of flat rooftops Ehor can be calculated as
where GSTC and TSTC are the solar irradiation and temperature under the standard working conditions of PV panels,and τ is the temperature coefficient of the power generation efficiency of the PV panels.
2.3.2 Sloped rooftop
The PF of the sloped rooftops is equal to the installable area discount factor κinc,and the installed capacity of PV can be calculated as:
where Capinc and Sinc are the installed capacity and area of the sloped rooftop,respectively.
The PV generation potential of sloped rooftops Einc is calculated as:
2.4 Method of evaluating the economic efficiency of rooftop PV
NCF refers to the annual cash inflow (CI) minus the annual cash outflow (CO),which reflects the financial status of the building PV system during the actual operation period and is an ideal economic efficiency evaluation method.NCF can be calculated as follows:
where EPV is the generation potential of rooftops PV,λ is the self-consumption ratio of PV generation,cs is the feed-in price (FIP) of PV generation,cb is the electricity purchase price (EPP) of users,and CO&M is the operation and maintenance cost.
The NPV reflects the profitability of the project and is the total value of the annual net cash flow value within the whole life cycle of the rooftop PV.It is calculated as:
where C0 is the initial investment value of the project,mainly including the cost of PV panels Cp,inverter Cinv,structural components Cstr,and other electrical components Ce,as shown in (20).r is the discount rate (6.4%).

where Capinv,Capstr,and Cape indicate the installation capacity of each part; cp,cinv,cstr,and ce indicate the unit price of each part in the investment.
The DPBP refers to the time required to offset the total investment of the project considering the value of time.The shorter the DPBP,the earlier the initial investment payback period,and the stronger the value-added ability and risk resistance of the project.The calculation method is as follows:
The IRR is the discount rate when the NPV is 0,which can dynamically,comprehensively,and completely reflect the economic return and the potential maximum internal profitability of the project throughout the life cycle.The calculation method is as follows:
3 Case study
3.1 Study area and data
The area of study is in Da Xing district,Beijing(116°48′E,40°16′N),as shown in Fig.7,and the whole study area is 546.84 km2.GF7 is China’s first domestic submeter-class civilian two-linear array stereotactic mapping satellite equipped with a 0.65 m resolution rearview panchromatic camera and a 0.8 m resolution forwardlooking panchromatic camera forming a dual-line array stereogram capability.Blue,green,red,and near-infrared 4-band multispectral images can be obtained,and the fusion with rearview images can form multispectral fusion images with a resolution of 0.65 m [35].
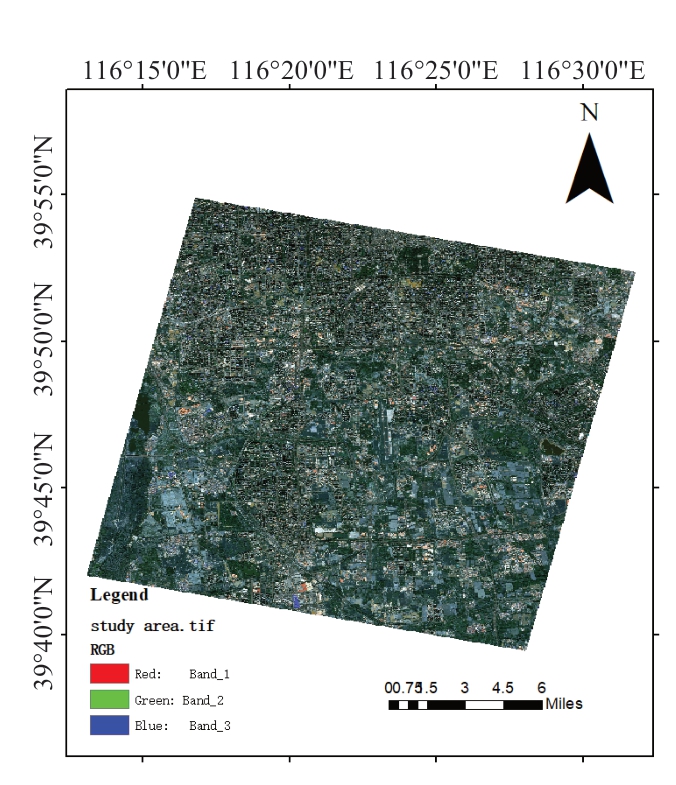
Fig.7 Scope of the study area
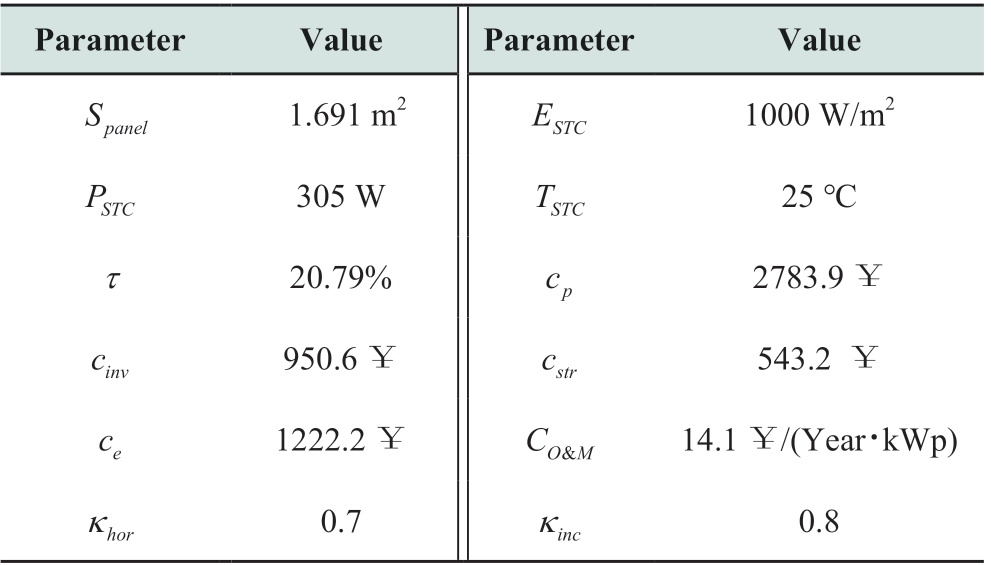
The POI used in this study is a specific point location that someone may find useful or interesting.The term is widely used in cartography,especially in electronic variants,including GIS and Global Positioning System navigation software.In this study,a POI specifies,at minimum,the latitude and longitude and the kind of buildings,such as the C&I of the POI.The PV module used in this study is a monocrystalline silicon PV panel of Longi LR6-60HPB-305M,and the parameters of the rooftop PV system are shown in Table 2 [36].The efficiency of the PV panels decays by 2% in the first year and 0.55% per year thereafter.
Table 2 Parameters of the rooftop PV system
The typical annual solar irradiation data of DNI,DHI,and GHI are obtained from the National Renewable Energy Laboratory [37].The calculated result of the annual solar radiation is 5447 MJ/m2,which is in the range of 4600~5700 MJ/m2.The EPP of C&I users in the study area adopts the time-of-use EPP.C&I users no longer enjoy PV subsidies currently,and their FIP of PV generation is equal to the electricity price of local desulfurization coal-fired units.The resident users still enjoy the PV generation subsidy of 0.03 ¥/kWh.The specific electricity prices for different types of users in the study area are shown in Fig.8 [38].
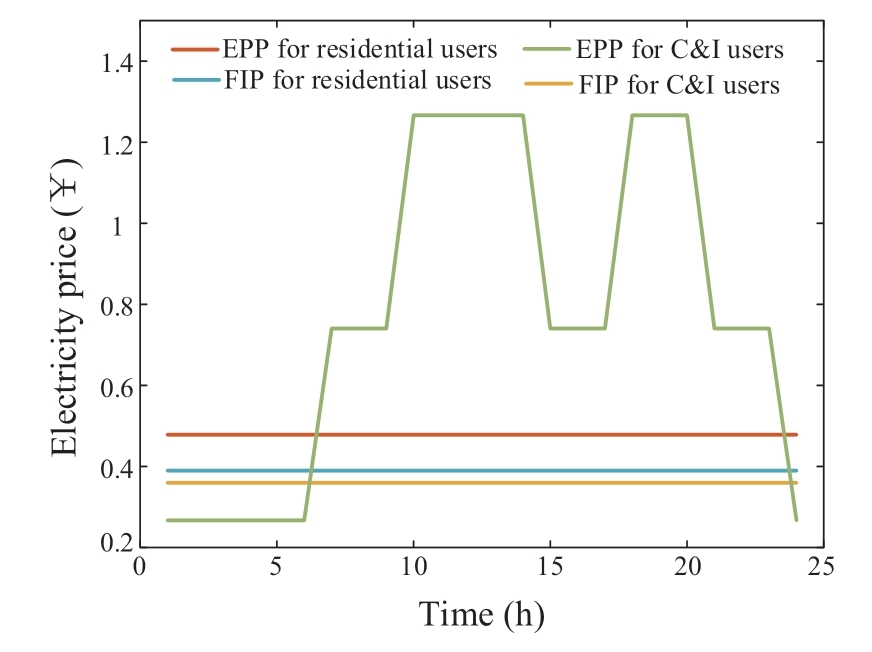
Fig.8 Electricity prices for C&I and residential users
3.2 Results of rooftop extraction
Using the method proposed in this study,the total number and area of rooftops in the research area are 28676 and 24.04 km2,respectively.The numbers and areas of different types of roofs are shown in Table 3.
Table 3 Rooftop number and area
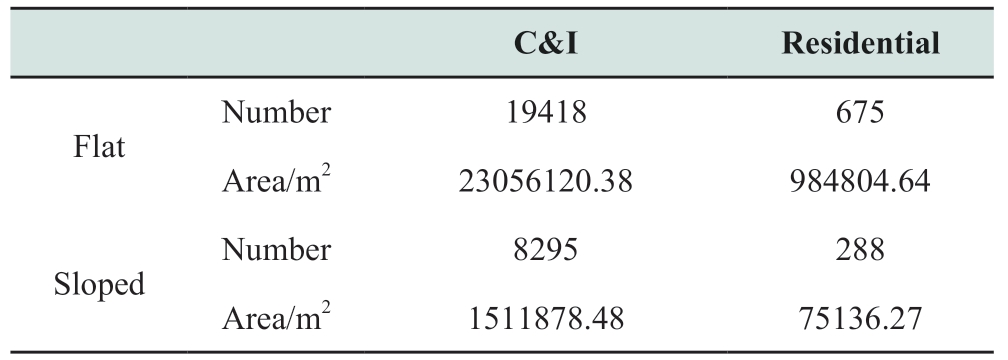
In Table 3,most of the rooftop area is owned by the C&I users.The area of flat rooftops accounts for a large proportion in both C&I and residential users.Moreover,the specific proportions of different sloped rooftops are shown in Figs.9 and 10.
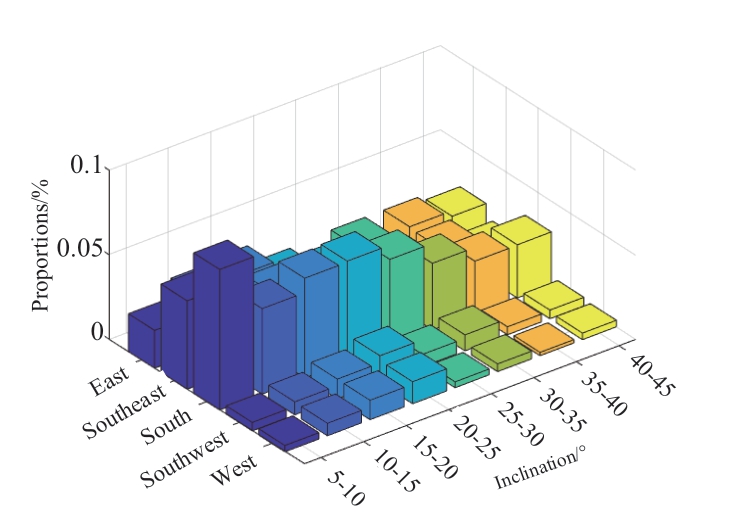
Fig.9 The proportion of different types of sloped rooftops in C&I users
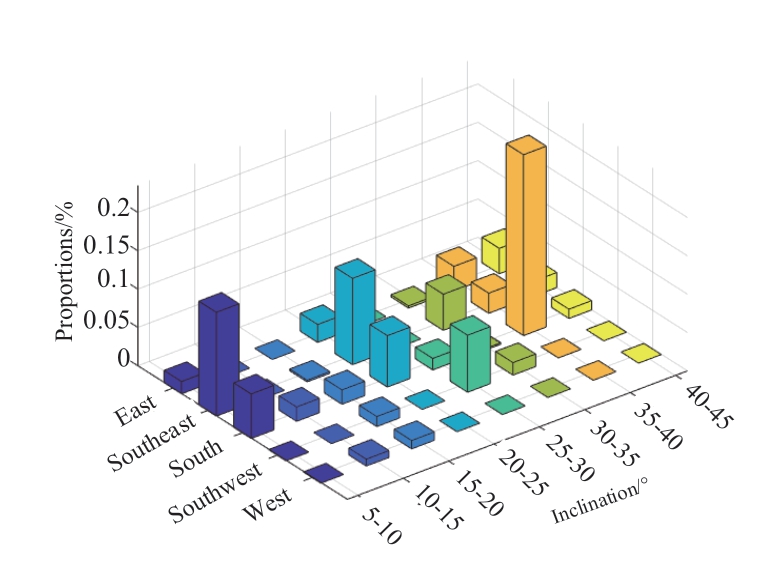
Fig.10 The proportion of different types of sloped rooftops in residential users
3.3 Results of rooftop PV generation potential
For flat roofs,the optimal inclination angle is calculated to be 35°.Table 4 shows the installed capacity of rooftop PV on flat and sloped rooftops.
Table 4 Installed capacity of rooftop PVs

The total installed capacity in the study area is calculated as 1487.45 MWp.The average area for rooftop PV projects in this study is 18.89 m2/kW,which is close to the 21 m2/kW published by the Ministry of Natural Resources [39].Based on the installed capacity data above,the annual PV generation potential of rooftops in the study area is 2832.23 GWh.The average daily PV generation in different months is shown in Fig.11.
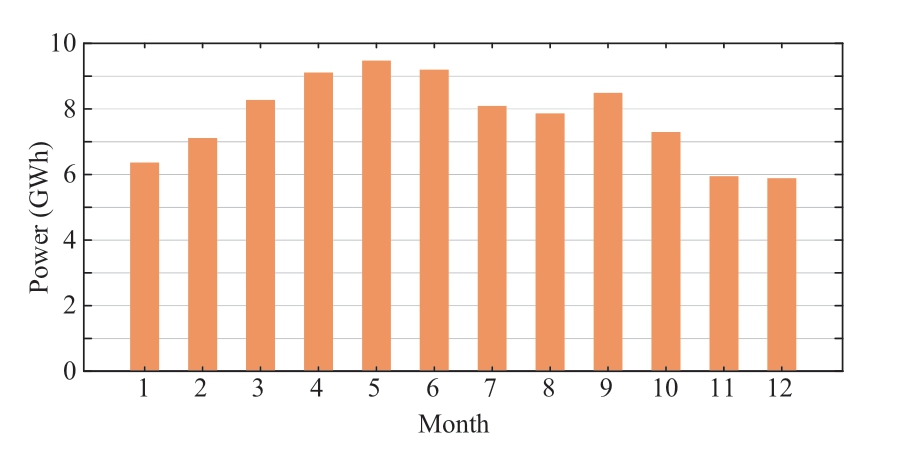
Fig.11 Average daily PV generation potential in different months
As shown in Fig.11,the maximum daily average rooftop PV generation in this area appeared in April.Conversely,April has a more significant amount of solar irradiation than the autumn and winter months.Contrarily,the PV panels have higher power generation efficiency due to lower ambient temperature in the summer months.
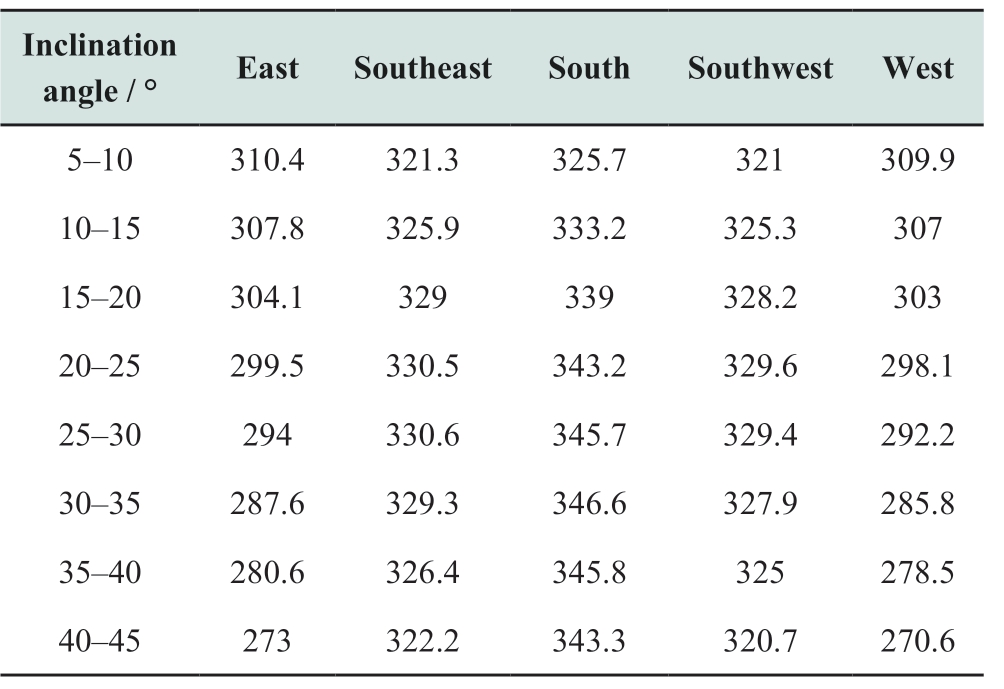
The annual PV generation per unit area of different rooftops is calculated to facilitate the analysis of the PV generation potential of different rooftops.The result of the flat rooftop is 143.631 kWh,and the results of different sloped rooftops are shown in Table 5.
From Table 5,the annual PV generation of south-facing sloped roofs is the largest,followed by the southeast- and southwest-facing sloped rooftops,and the PV generation of the east- and west-facing sloped roofs are the least influenced by sunlight hours.
Since the optimal inclination angle is 35°,the annual PV generation potential of south-,southeast- and southwestfacing sloped rooftops increases and then decreases withthe increasing inclination angle.However,the annual PV generation potential of the east- and west-facing sloped rooftops keeps decreasing with increasing inclination angle.This is because the light hours on the PV panels decrease as the inclination angle increases.In addition,the annual PV generation potential of all types of sloped rooftops in Table 5 is greater than that of flat rooftops.
Table 5 Annual PV generation of the unit area on different types of sloped rooftops/kWh
3.4 Results of rooftop PV economic efficiency evaluation
The economic efficiency of rooftop PV is influenced by the type of users and the percentage of self-consumption.It is assumed that the proportion of self-consumption of PV generation is equal in each time slot.For C&I users,the PV generation revenue is calculated separately in different time slots of the time-of-use EPP.The results of economic efficiency evaluation under the self-consumption ratio of 50% are shown in Table 6.
Table 6 Economic evaluation results

The economic efficiency evaluation results of residential and C&I users with the changing self-consumption ratio are shown in Fig.12.
In Fig.12,as the self-consumption rate increases,the NPV and IRR increase,and DPBP decreases for both C&I and residential users,providing better economic efficiency.This is because the EPP is greater than the FIP,so increasing the self-consumption ratio can make the PV generation produce higher economic efficiency.Since the difference between EPP and FIP is larger for C&I users than residential users,the performance of the economic indicators for C&I users improves even more as the selfconsumption rate increases.In addition,the economic efficiency results for the full feed-in grid mode and the full self-use mode of PV generation correspond to the case of 0%and 100% self-consumption ratios in Fig.12,respectively.
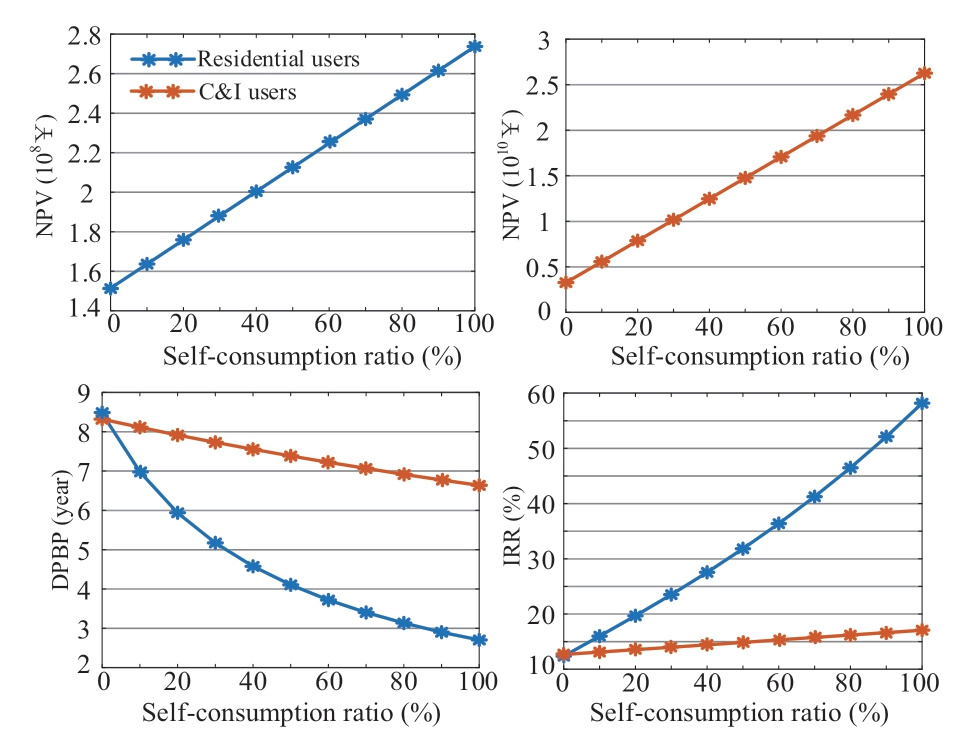
Fig.12 Results of economic efficiency evaluation under different self-consumption ratio
4 Conclusion
This paper proposes a comprehensive framework to estimate the regional rooftop PV potential.First,using GF7 satellite images as the data source,the contours of the regional rooftops,i.e.,the area,are obtained employing the Unet semantic segmentation network.Then,based on the established nDSM,the azimuth and inclination angle of each roof are calculated.Furthermore,the rooftop owners in the area are divided into C&I and residential users.The above steps complete the extraction of the rooftop information in the research area.The isotropic sky transposition model is used to obtain the solar irradiation on POA.Based on the extracted rooftop information,the PV installed capacity and generation potential of each type of rooftop are calculated.Finally,three economic indicators are used to evaluate the economic efficiency of rooftop PV.
The estimated rooftop PV potential for Da Xing district,Beijing,was completed based on the framework proposed in this study.The total rooftop area and the installed capacity of PV are 25.63 km2 and 1487.45 MWp,respectively.The annual rooftop PV generation potential is 2832.23 GWh,and the maximum power generation occurs in April.The PV generation potentials of sloped roofs with different azimuths and inclination angles were compared and analyzed.Finally,with a 50% self-consumption ratio,NPV is 1.498×10¹⁰ ¥,DPBP is 4.18 years,and IRR is 31.03%.The results show that the research region has significant economic returns on rooftop PV.
Acknowledgements
This work was supported by the Global Energy Interconnection Group Co.,Ltd.,Science and Technology Project (SGGEIG00JYJS2100032).
Declaration of Competing Interest
The authors have no conflicts of interest to declare.
References
[1]IEA renewables 2020 solar PV.https://www.iea.org/reports/rene wables-2020/solar-pv#abstract.Accessed 10 Sep 2021
[2]Construction and operation of photovoltaic power generation of China in 2021.http://www.nea.gov.cn/2022-03/09/c_131050811 4.htm.Accessed 7 Apr 2022
[3]Energy Foundation China (2020) China’s new growth pathway:From the 14th Five-Year Plan to carbon neutrality.In: SPM_Synthesis-Report-2020-on-Chinas-CarbonNeutrality.Available via Energy Foundation.https://www.efchina.org/Reports-en/rep ort-lceg-20201210-en.Accessed 9 Nov 2021
[4]Chen H,Chen W (2021) Status,trend,economic and environmental impacts of household solar photovoltaic development in China: Modelling from subnational perspective.Applied Energy,303: 117616
[5]The Central People's Government of the People’s Republic of China.http://www.gov.cn/zhengce/zhengceku/2021-09/15/conte nt_5637323.htm.Accessed 12 Oct 2021
[6]Gassar A,Cha S (2021) Review of geographic information systems-based rooftop solar photovoltaic potential estimation approaches at urban scales.Applied Energy,291: 116817
[7]Defaix P,Van S,Worrell E,et al.(2012) Technical potential for photovoltaics on buildings in the EU-27.Solar Energy,86(9):2644-2653
[8]Mohajeri N,Assouline D,Gudmundsson A,et al.(2017) Effects of city size on the large-scale decentralised solar energy potential.Energy Procedia,122: 697-702
[9]Izquierdo S,Rodrigues M,Fueyo N (2008) A Method for estimating the geographical distribution of the available roof surface area for large-scale PV energy-potential evaluations.Solar Energy,82(10): 929-939
[10]Xu S,Jiang H,Xiong F,et al.(2021) Evaluation for block-scale solar energy potential of industrial block and optimization of application strategies: A case study of Wuhan,China.Sustainable Cities and Society,72: 103000
[11]Yue C D,Huang G R (2011) An evaluation of domestic solar energy potential in Taiwan incorporating land use analysis.Energy Policy,39(12): 7988-8002
[12]Singh R,Banerjee R (2015) Estimation of rooftop solar photovoltaic potential of a city.Solar Energy,115: 589-602
[13]Jakubiec J A,Reinhart C F (2014) A method for predicting citywide electricity gains from photovoltaic panels based on LiDAR and GIS data combined with hourly Daysim simulations.Solar Energy,93: 127-143
[14]Machete R,Falcão A,Gomes M,et al.(2018) The use of 3D GIS to analyse the influence of urban context on buildings’ solar energy potential.Energy and Buildings,177: 290-302
[15]Singh R,Banerjee R (2015) Estimation of rooftop solar PV potential of a city.Solar Energy,115: 589-602
[16]Sun Y,Hof A,Wang R,et al.(2013) GIS-based approach for potential analysis of solar PV generation at the regional scale: A case study of Fujian Province.Energy Policy,58: 248-259
[17]Yang Y,Campana P E,Stridh B,et al.(2020) Potential analysis of roof-mounted solar photovoltaics in Sweden.Applied Energy,279: 115786
[18]Mainzer K,Fath K,McKenna R,et al.(2014) A high-resolution determination of the technical potential for residential-roofmounted photovoltaic systems in Germany.Solar Energy,105:715-731
[19]Buffat R,Grassi S,Raubal M (2018) A scalable method for estimating rooftop solar irradiation potential over large regions.Applied energy,216: 389-401
[20]Rodríguez L R,Duminil E,Ramos J S,et al.(2017) Assessment of the photovoltaic potential at urban level based on 3D city models: A case study and new methodological approach.Solar Energy,146: 264-275
[21]Zhong T,Zhang Z,Chen M,et al.(2021) A city-scale estimation of rooftop solar photovoltaic potential based on deep learning.Applied Energy,298: 117132
[22]Song X,Huang Y,Zhao C,et al.(2018) An approach for estimating solar photovoltaic potential based on rooftop retrieval from remote sensing images.Energies,11(11): 3172
[23]Mohajeri N,Assouline D,Guiboud B,et al.(2018) A city-scale roof shape classification using machine learning for solar energy applications.Renewable Energy,121: 81-93
[24]Zhang C,Li Z,Jiang H,et al.(2021) Deep learning method for evaluating photovoltaic potential of urban land-use: A case study of Wuhan,China.Applied Energy,283: 116329
[25]Zhong T,Zhang Z,Chen M,et al.(2021) A city-scale estimation of rooftop solar photovoltaic potential based on deep learning.Applied Energy,298: 117132
[26]Ordóñez J,Jadraque E,Alegre J,et al.(2010) Analysis of the photovoltaic solar energy capacity of residential rooftops in Andalusia (Spain).Renewable and Sustainable Energy Reviews,14(7): 2122-2130
[27]Wiginton L K,Nguyen H T,Pearce J M (2010) Quantifying rooftop solar photovoltaic potential for regional renewable energy policy.Computers,Environment and Urban Systems,34(4): 345-357
[28]He L,Zhang S,Chen Y,et al.(2018) Techno-economic potential of a renewable energy-based microgrid system for a sustainable large-scale residential community in Beijing,China.Renewable and Sustainable Energy Reviews,93: 631-641
[29]Coria G,Penizzotto F,Pringles R (2019) Economic analysis of photovoltaic projects: The Argentinian renewable generation policy for residential sectors.Renewable Energy,133: 1167-1177
[30]Huang S,Rich P M,Crabtree R L,et al.(2008) Modeling monthly near-surface air temperature from solar radiation and lapse rate: Application over complex terrain in Yellowstone National Park.Physical Geography,29(2): 158-178
[31]El Mghouchi Y,El Bouardi A,Choulli Z,et al.(2014) New model to estimate and evaluate the solar radiation.International Journal of Sustainable Built Environment,3(2): 225-234
[32]Yoshida S,Ueno S,Kataoka N,et al.(2013) Estimation of global tilted irradiance and output energy using meteorological data and performance of photovoltaic modules.Solar Energy,93: 90-99
[33]Singh R (2020) Approximate rooftop solar PV potential of Indian cities for high-level renewable power scenario planning.Sustainable Energy Technologies and Assessments,42: 100850
[34]Vries T N C,Bronkhorst J,Vermeer M,et al.(2020) A quickscan method to assess photovoltaic rooftop potential based on aerial imagery and LiDAR.Solar Energy,209: 96-107
[35]Land observation satellite data service platform.http://36.112.130.153:7777/DSSPlatform/index.html.Accessed 20 Aug 2021
[36]PV panel products.https://www.solaris-shop.com/.Accessed 17 Sept 2021
[37]National solar radiation database.https://nsrdb.nrel.gov/.Accessed 11 Sept 2021
[38]Beijing municipal commission of development and reform.http://fgw.beijing.gov.cn/fzggzl/qzjgf20zn/jz/.Accessed 21 Sept 2021
[39]Zhang X,Feng S,Zhang H,et al.(2020) Developing distributed PV in Beijing: Deployment potential and economics.Frontiers in Energy Research,2020: 155


Received: 28 January 2021/Accepted: 26 April 2022/Published: 25 June 2022
Hongfeng Li lihongfeng@tju.edu.cn
Boyu Chen bychen@tju.edu.cn
Yanbo Che lab538@163.com
Jingkai Wang wjkzzhn@163.com
Linjun Yu yulj201831@aircas.ac.cn
Dacheng Wang wangdc@aircas.ac.cn
2096-5117/© 2022 Global Energy Interconnection Development and Cooperation Organization.Production and hosting by Elsevier B.V.on behalf of KeAi Communications Co.,Ltd.This is an open access article under the CC BY-NC-ND license (http://creativecommons.org/licenses/by-nc-nd/4.0/).
Biographies
Boyu Chen received his B.S.and M.S.degrees at Tianjin University,Tianjin,in 2018 and 2021,respectively.He is working towards his Ph.D.degree in electrical engineering at Tianjin University,Tianjin.His research interests include photovoltaic generation and active distribution networks.
Yanbo Che received his B.S.degree from Zhejiang University,Hangzhou,China,in 1993.He received his M.S.and Ph.D.degrees from Tianjin University,Tianjin,China,in 1996 and 2002,respectively.Since 1996,he has been engaged in teaching and scientific research on power electronic technology and power systems.He is presently a Professor in the School of Electrical and Information Engineering at Tianjin University.His current research interests include power systems,renewable energy resources,and microgrids.
Jingkai Wang is from Zhengzhou,Henan,and working towards his Master's degree at the Chinese Academy of Sciences.His research interest is cartography and geographical information system.
Hongfeng Li was born in Tianjin.China.in 1979.She received the M.S.degree in intelligent control of electric drive systems and the Ph.D.degree in magnetic field analysis from Tianjin University,Tianjin,China,in 2005 and 2008,respectively.She is currently an Associate Professor in the School of Electrical Engineering and Automation,Tianjin University,Tianjin.Her current research interests include photovoltaic generation and electrical machines.
Linjun Yu is an Assistant Researcher at the National Engineering Research Center of Remote Sensing Application in Aerospace Information Research Institute,Chinese Academy of Sciences.He received his M.S.and Ph.D.degrees from Chia Agriculture University,Beijing,China,in 2004 and 2012,respectively.His research interests include geospatial analysis and simulation.
Dacheng Wang is a Senior Engineer at the National Engineering Research Center of Remote Sensing Application in Aerospace Information Research Institute,Chinese Academy of Sciences.He received his M.S.and Ph.D.degrees from Zhejiang University,Hangzhou,China,in 2004 and 2012,respectively.His research interests include geospatial analysis and smart city projects.Recently,he has been devoted to the research of remote sensing application of low carbon environment in the Daxing functional area of Beijing.
(Editor Yajun Zou)
