0 Introduction
Healthy operation of a generator is critical to maintain the security and stability of a power grid.As the most common fault of a synchronous generator, the inter-turn short-circuit fault of excitation windings leads to an increase in excitation current, distortion of voltage waveform,reduction of reactive power, vibration change of stator and rotor, circulating current between parallel branches in stator,and other problems in the generator [1-6].When the interturn short-circuit fault of the field windings is minor, it has an insignificant impact on the operational performance of the generator.However, if a slight inter-turn shortcircuit fault is not cleared in time, it may cause a one-point grounding fault or two-point grounding fault of the rotor owing to the local overheating at the fault point, which may cause the generator to burn out.Therefore, fault diagnosis results under mild short-circuit fault of the excitation winding of the generator can provide a reference for setting a reasonable maintenance time and timely troubleshooting to prevent the fault from further developing into a serious fault and play the role of early fault warning.
Model-based methods, offline detection methods,and online detection methods are used for diagnosing the inter-turn short circuit in the field winding of electric machines.The model-based methods, such as multiloop [7-8] and finite element analysis [9], study the characteristics of generators under faulty conditions and provide a theoretical basis for fault diagnosis.Usually,these approaches require precise and reliable structural data of the generator.However, it is difficult for users to obtain these parameters.It also incurs a large calculation cost to obtain the quantitative values of fault characteristics of the generator under different operating conditions.Offline detection methods mainly include open transformer method, alternating current (AC) impedance and power loss method, direct current (DC) resistance method, no-load and short-circuit characteristic test method, and recurrent surge oscillograph (RSO) method.These methods are more suitable for detecting serious faults rather than minor faults[3-5].Compared with offline detection methods, online detection methods can find minor faults in time; these methods include detection coil method [10] and style="font-size: 1em; text-align: justify; text-indent: 2em; line-height: 1.8em; margin: 0.5em 0em;"> style="font-size: 1em; text-align: justify; text-indent: 2em; line-height: 1.8em; margin: 0.5em 0em;">In 2006, Hinton proposed a new multi-layer neuralnetwork-training method that broke the bottleneck of the traditional back propagation (BP) training method and opened a new chapter on deep learning [23].Deep learning has been explored since it was first proposed in 2006, and its applications in industrial production [24],big data analysis [25], and speech recognition [26] have achieved remarkable results.Various studies have reported the application of deep learning in the fault diagnosis of motors and generators.References [16] and [17] applied a deep learning network composed of a self-encoder stack for fault classification diagnosis of permanent magnet motors.Reference [18] proposed a multi-scale kernel-based residual Convolutional Neural Network (CNN), which could diagnose faults by extracting the vibration signal of the motor.Reference [19] combined a one-dimensional CNN with a gated recurrent unit (GRU) and applied it to the fault identification of hydraulic turbines.Reference[20] proposed a monitoring method based on depth joint variational autoencoders (JVAE), which can achieve a more effective WT gearbox fault diagnosis by using supervisory control and data acquisition (SCADA) data.Reference [21]proposed a novel imbalanced fault-diagnosis method based on enhanced generative adversarial networks (GAN) to avoid data imbalance problems in the motor fault diagnosis.
Each method has its advantages and disadvantages;therefore, it is difficult to find a fault-diagnosis method that is perfect in every respect.The model-based method can better explain the physical principle and relationship between the physical quantities of the generator.However,it requires not only precise and reliable structural data, but also considerable simplification to obtain the mathematical model of the generator.It typically applies signal processing technology, such as Fourier transform and wavelet analysis,to extract fault harmonic features.However, the harmonic feature is weak in the slight fault state.The style="font-size: 1em; text-align: justify; text-indent: 2em; line-height: 1.8em; margin: 0.5em 0em;">When an inter-turn short-circuit fault occurs in a synchronous generator, the exciting current increases, and the reactive power decreases.Reference [27] analyzed in detail the relationship between the excitation current and generator apparent power, reactive power and terminal voltage.An inter-turn short circuit in the field winding during generator operation is reflected by these variables.Among these variables, the change in the excitation current and reactive power was more sensitive to the short-circuit fault between the turns of the excitation winding.Although the excitation current and reactive power reflect the interturn short circuit of the excitation winding, it will not alert if their values do not exceed the limitation values specified by industry standards during slight faults or light loads.Therefore, a better method for fault diagnosis is to predict the feature values of the healthy condition of generators.Deep learning can effectively perform this function.
Based on selecting the fault indicator, this study proposes an early fault online-diagnosis method based on gate recurrent unit convolutional neural networks (GRUCNN) for inter-turn short-circuit diagnosis of the excitation winding of the synchronous generator.The GRU-CNN can be utilized to mine the functional relationship between the fault characteristics and the associated physical quantities of the generator, which are used as the network output and input, respectively.The GRU-CNN was trained with monitoring data under the healthy condition of the generator.When the monitoring data under the actual operation are input into the trained model, it can be determined if the generator has failed.The method proposed in this paper can directly fit the relationship between network input and output and does not require additional processing of the collected data, such as spectrum analysis.The contributions of this study are summarized as follows:
· Improved particle swarm optimization (IPSO) was proposed to optimize the structure of GRU-CNN.The optimized GRU-CNN was applied to mine the relationship between the generator operating data to realize fault diagnosis.
· Two fault indicators, excitation current and reactive power, were fused to diagnose faults to increase the reliability of the diagnosis.
· The fault warning time and fault warning ratio overcome the problem of fault misjudgment caused by the external influence of the acquisition equipment and the model itself.
The content of the article is organized as follows.In Section 1, we introduce the network structure and parameter selection in detail.In Section 2, the experiment performed on a fault simulation synchronous generator is presented:the data under the healthy state were used to train the GRU-CNN, and the data under the fault state of the interturn short circuit of field windings were used to verify the reliability of the fault diagnosis method.The conclusions are presented in Section 3.
1 Fault warning model
1.1 Overall scheme for fault warning
Because a synchronous generator is a complex coupling system of electricity, magnetism, heat, fluid, and stress,there is a many-to-many relationship between its fault types and fault characteristics [28].In contrast to other faults,the excitation current and reactive power change when the inter-turn short circuit occurs in the excitation winding of a synchronous generator; therefore, the excitation current and reactive power were selected and fused as fault characteristic indicators [27].
Two subnetworks of GRU-CNN were constructed:GRU_1 and GRU_2.GRU_1 has the excitation current of the generator as network output and three-phase voltage,three-phase current, excitation voltage, and reactive power of the generator as the network input.GRU_2 has the reactive power as network output and three-phase voltage,three-phase current, excitation voltage, and excitation current of the generator as network input.The fault diagnosis process was as follows:
(1) The normal operation data of the generator were respectively input into GRU_1 and GRU_2 to train the network.The root-mean-square error (RMSE) was used as the network evaluation standard, and the structure of the network was determined using improved particle swarm optimization (IPSO) algorithm.
(2) The Euclidean distance between the output value of the network and the actual measured value was calculated and recorded as the offset distance.The offset distances of the two subnetworks were merged by weight distribution to obtain the total offset distance, which was used to determine the fault warning threshold and fault warning ratio.
(3) The monitoring data were input into the trained faultwarning model to calculate the total offset distance.
(4) The fault-warning time was determined according to the actual needs.During the fault-warning time, if the faultwarning ratio was greater than the fault-warning value, the generator was judged to have a fault.
The fault warning flowchart is shown in Fig.1.
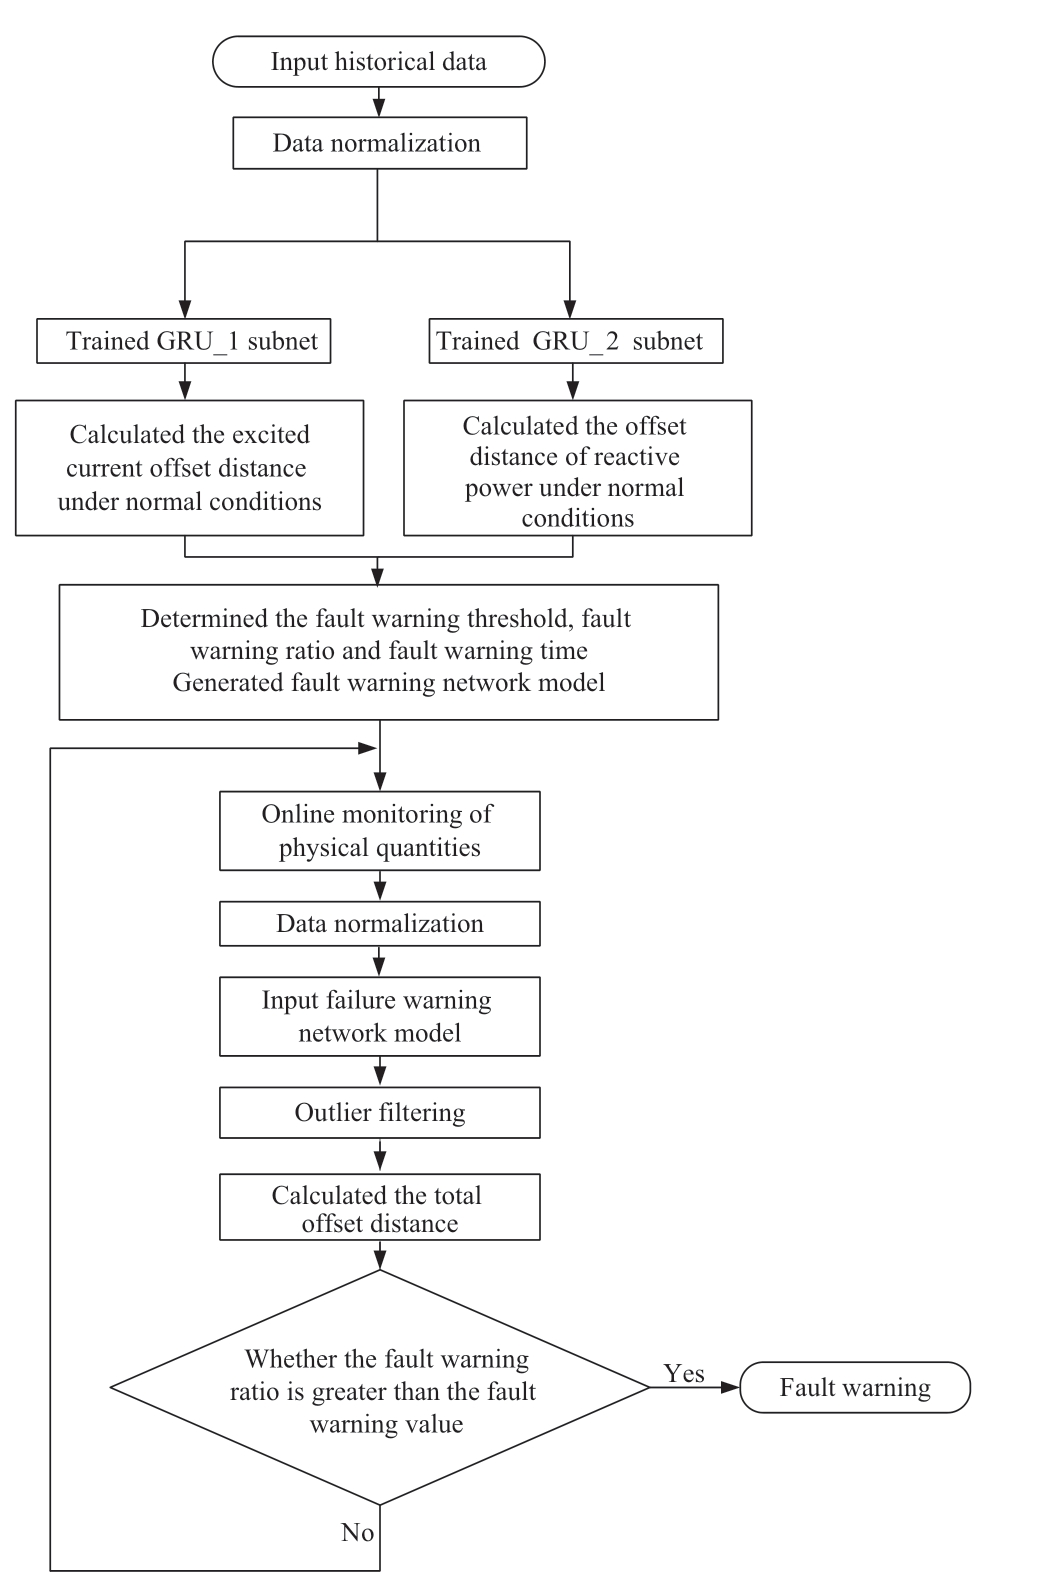
Fig.1 The fault warning flowchart
1.2 Network structure
The GRU network was an improved recurrent neural network (RNN).The GRU network solved the problem of gradient disappearance or explosion in the width="90" height="25" src="http://geidco.95598bj.net/global%20energy%20interconnection202202/images/8e1f0a75a4d2f1c9cee9164d33ffb757.jpg" style="max-width: 100%; height: auto; vertical-align: middle;">The information transferred in the GRU is shown in Fig.2.
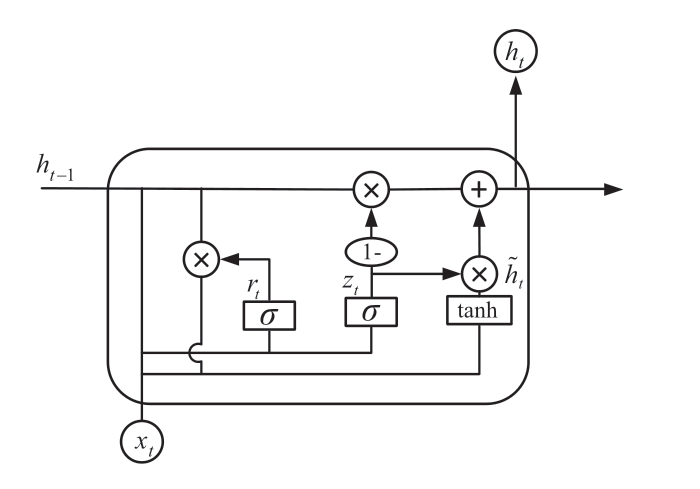
Fig.2 GRU information transfer diagram
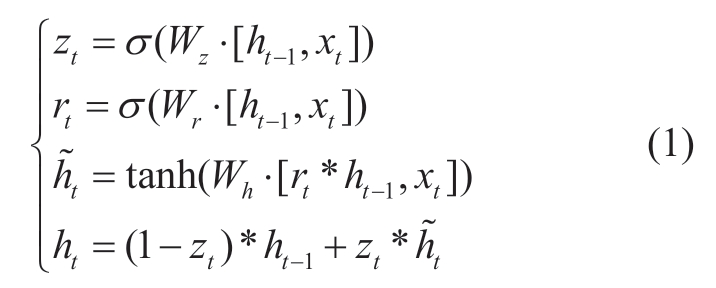
where zt is the update gate output, rt is the reset gate output,ht is the current output, ht-1 is the previous output,  is the output of the current state, xt is the current input, and σ is the sigmoid excitation function.Wz, Wr and Wh represent the updating door weight, resetting door weight and output door weight, respectively.Symbol * represents the element-wise multiplication of corresponding matrices.
Although the GRU network had a super-processing capacity in terms of longtime dependent sequences, each GRU contained parameters of two gates, which led to excessive GRU-network parameters and high requirement of the computer processing performance.In addition, the GRU network retained the style="font-size: 1em; text-align: justify; text-indent: 2em; line-height: 1.8em; margin: 0.5em 0em;">Each filter in the convolutional layer performed feature extraction from the input sample, and the feature dimension of the sample was converted into the number of filters.After the original input data were passed through the convolutional layer, the feature map was obtained.
where ci,j represents the element in the ith row and jth column of the feature graph, f is the activation function.b is the length of the convolutional kernel, s is the filter step size, n denotes the characteristic dimension of the input data, wk,l is the weight of the filter in rows k and l, hi×s+k,l is the element in rows i+k and column l of the input data, and wb is the filter bias.
The pooling layer filtered the redundant historical information.There are many pooling methods and the most commonly used is maximum pooling.
where hp represents the pooling result.
1.3 Data preprocessing and metrics selection
First, we normalized the measured data as follows:
where x represents the measured data, xˆ is the normalized value of x, xmax and xmin are the upper and lower limits of the measured data, respectively.y is the network output.yˆ is the normalized value of y.ymax and ymin are the upper and lower limits of network output, respectively.
Two GRU-CNN sub-networks, GRU_1 and GRU_2,were built with the excitation current and reactive power as the network outputs, and the sub-network was encapsulated with the full connection layer.The mean absolute error(MAE) was used as the network loss function, and RMSE was used as the network evaluation function.
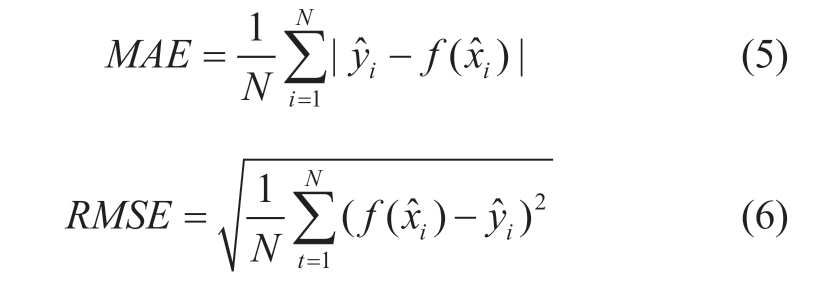
where, N is the number of samples, is the normalized measured excitation current or reactive power, and
  represents the output value of the subnetwork model.
1.4 Structure parameters obtained by IPSO
The structural parameters of the GRU-CNN, including the number of network layers, number of neurons in each layer, and setting of training batches had a significant impact on the performance of the network.The structural parameters were obtained using IPSO algorithm.
PSO is an optimization algorithm that simulates the predation process of birds.It searches for an optimal target through information sharing between individuals and mutual assistance between groups.Although traditional PSO has the advantages of simple calculation and short convergence time, the simple iterative method causes the calculation result of PSO to easily converge to the local optimum.
Aiming at this problem, this paper proposes an IPSO that improves the traditional PSO in three aspects: the particle-update formula, particle-population division, and inertia weight.
Reference [29] proposed the use of a disturbance operator to jump out of the local extremum and improve PSO, which overcomes the shortcomings of PSO that easily converges to the local optimum.The particle updated formula after improvement was:

where w denotes inertia weight, c1 and c2 are learning factors, ppb and pgb are the individual and global optimal position, respectively, r1 and r2 are random constants uniformly distributed between [0,1], and r3 and r4 are the perturbation operators.
where T denotes the hysteresis step.It could simultaneously perturb the local optimum and global optimum to make the particles jump out of the local extrema.
Based on reference [30], an IPSO based on small-particle swarms is proposed in this study.We selected C optimal values from the initial values of the particle swarm as the center point of the small particle swarm.The non-central point particles used the closest central point as pgb, and updated their position and velocity according to Equation (7),while the update formula of the central point is

where pcgb is the optimal value among the C small particle swarms.w' is the adaptive inertia weight [31].
where wmax and wmin are the set maximum and minimum inertia weights, respectively, M is the total number of updates, t denotes the current update time.The adaptive inertial weight caused the particles to have a strong global exploration ability in the early stage of exploration and strong local exploration ability in the later stage of exploration.The introduction of small particle swarms found multiple extreme points, simultaneously, to make the probability of avoiding converging to the local optimum high.
1.5 Determination of warning threshold
1) Offset distance
After training the networks, the functional relationship between excitation current and its network input quantities,reactive power and its network input quantities can be obtained under normal operation of a synchronous generator.When the synchronous generator fails, the fault-feature value obtained from the trained functional relationship is different from the actual monitoring value,and the deviation between the predicted and measured values can be used to diagnose the fault.
The excitation current offset distance Dif was defined as the Euclidean distance between the excitation current output of GRU_1 and the measured excitation current at each time instant t and is shown as under:
Similarly, the reactive-power offset distance, DiA, was defined as the Euclidean distance between the reactivepower output of GRU_2 and the measured reactive power at each time instant t and is shown as follows:
where  are the measured values of the normalized excitation current and reactive power, respectively;
![]() are the network predicted values of excitation current and reactive power, respectively.
are the network predicted values of excitation current and reactive power, respectively.
The final total offset distance, Dit, combined with the excitation-current and reactive-power offset distances is defined as
where w f,wA are the excitation-current offset-distance weight and reactive-power offset-distance weight,respectively.
The weights of the excitation current offset distance and reactive power offset distance were assigned using a combination of the anti-entropy method.
The entropy of the data reflects the degree of disorder of the data, namely uncertainty.The entropy is defined as
where pi is the probability of the system, which has n states,being in the ith state.The greater the entropy, the greater is the uncertainty.The anti-entropy was positively correlated with the certainty of the system, which is defined as [32]
Subsequently, the anti-entropy weight of the ith fault indicator is

where m is the number of fault characteristics.
2) Warning threshold
Some data points always deviated significantly from the measured values when training the network model.These inaccurate data points would cause the early faultwarning threshold to be significantly large, which would affect the fault-diagnosis sensitivity of the model.To ensure generalization and good predictive ability of the training model, a box-plot was used to filter these outliers, and its structure is shown in Fig.3.
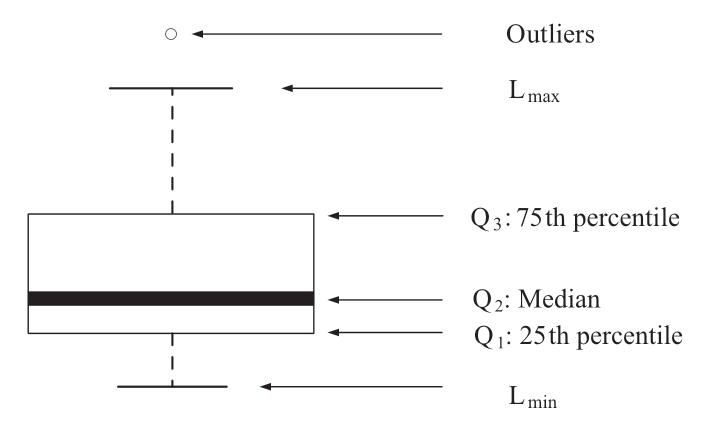
Fig.3 Box-plot
In Fig.3, Lmax and Lmin were as follows:

where, Q1, Q2, and Q3 denote the lower quartile, median,and upper quartile, respectively.
A value greater than Lmax was considered an outlier.After filtering the outliers, the total offset distance was obtained by the fusion of the normal offset distance of the excitation current and the normal offset distance of the reactive power, according to method of Equation (13).Twice the mean value of the total offset distance was considered as the fault warning threshold.
There was a certain error in the model, that is, even if the data during the normal operation of the generator were input into the trained GRU-CNN model, the offset distance between the network predicted value and the actual measured value of individual data still exceeded the warning threshold.Moreover, an inaccurate measurement because of external interference would also affect the network prediction value, which cannot be avoided in practice.Therefore, the fault-warning time and faultwarning ratio were used to avoid misdiagnosis.The faultwarning time can be determined according to the data collection frequency.The fault-warning ratio was defined as the percentage of samples whose total offset distance exceed the fault-warning threshold within the fault-warning time.If the fault warning ratio achieves the fault warning value,which should take a larger value to avoid misdiagnosis, the fault can be diagnosed.
2 Experimental verification
2.1 Data collection
A fault-simulation synchronous generator was used as the experimental object, and the generator parameters are listed in Table 1.
Table 1 Generator parameters
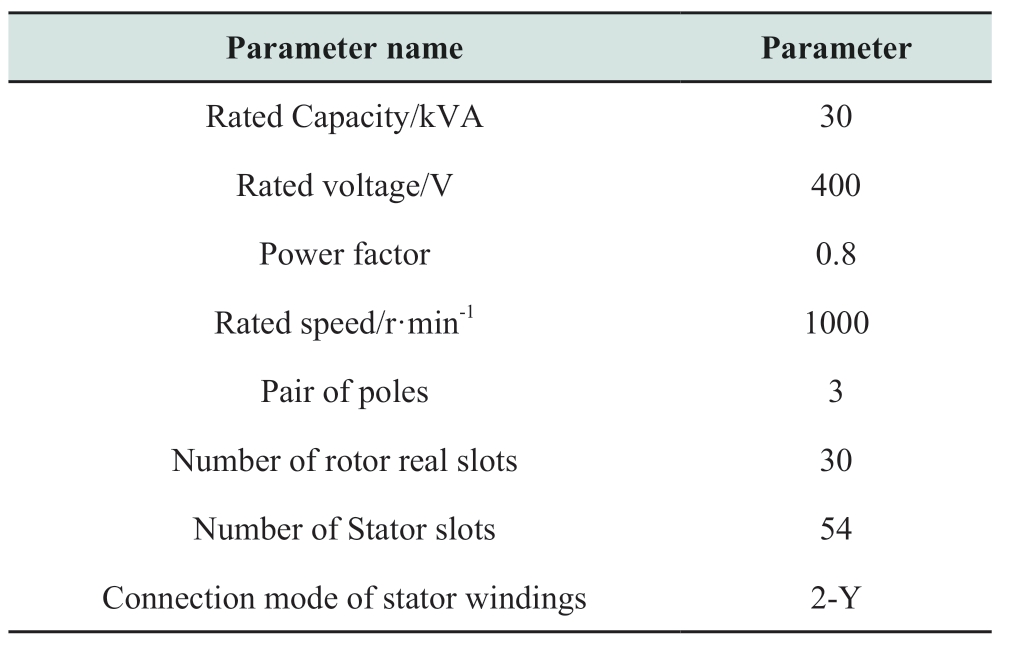
The physical quantities that where measured in this experiment are shown in Table 2.
Table 2 Measured physical quantities of synchronous generator
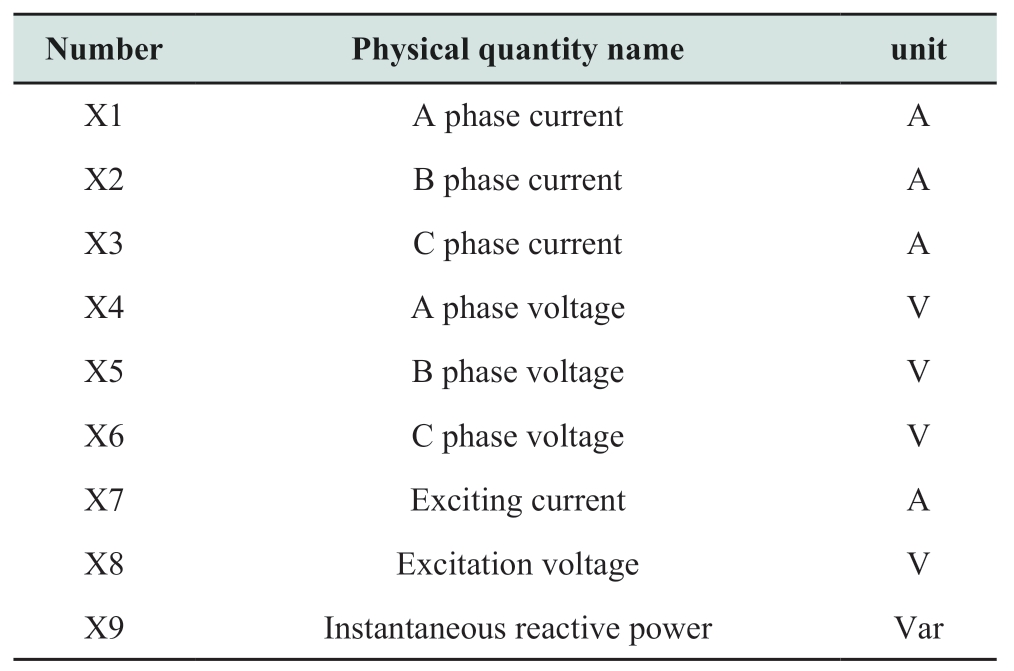
Among the listed quantities, X1-X8 were measured by Hall current and voltage sensors, and X9 was computed from X1 and X4 as
where N is the number of samples, x1i is the ith element of X1, x4i is the ith element of X4, and * represents the elementwise multiplication of vectors.The experimental wiring diagram is shown in Fig.4.
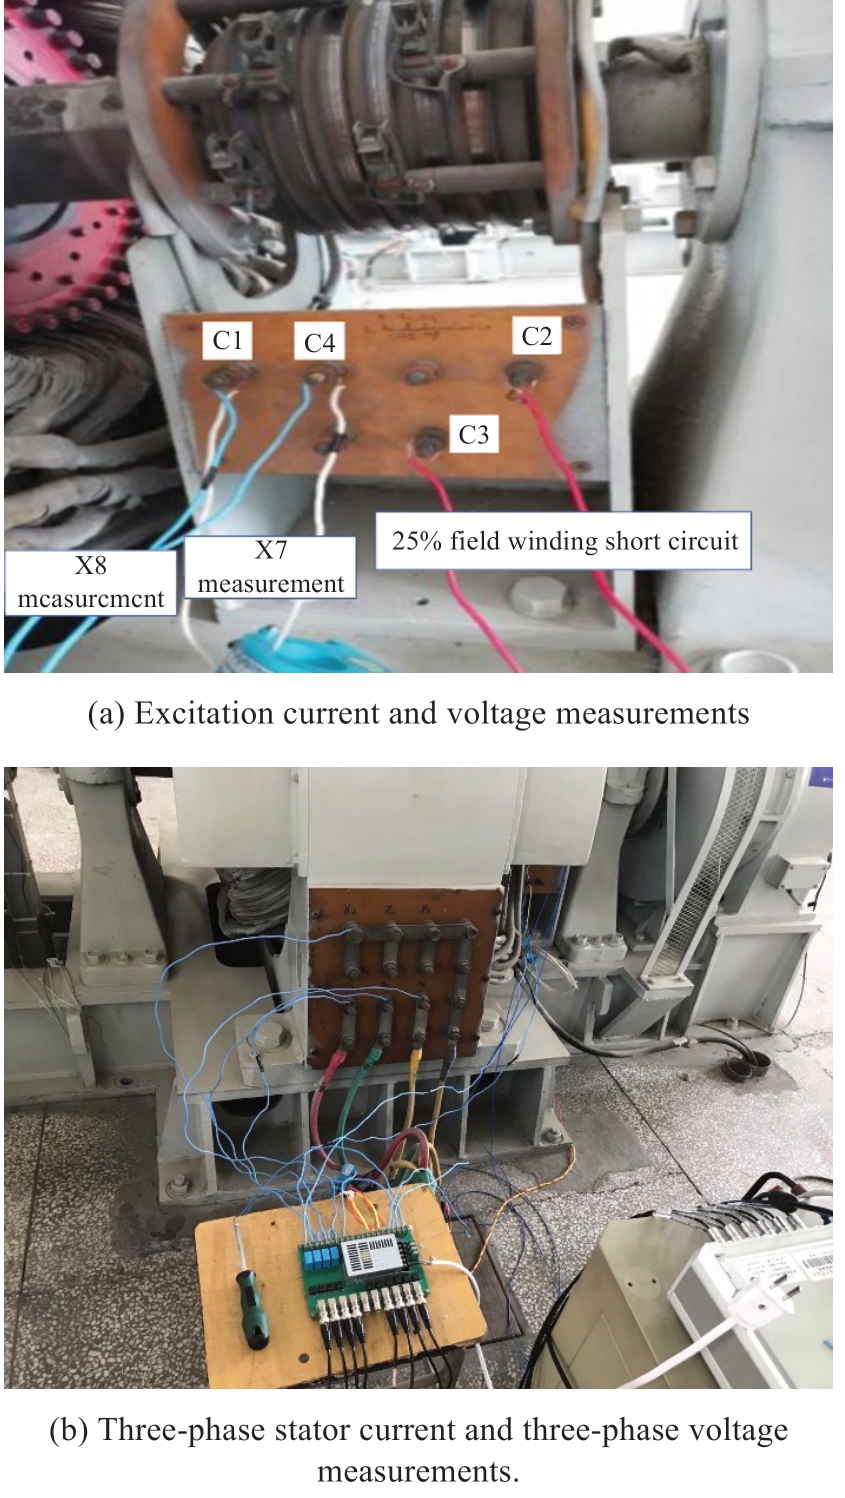
Fig.4 The experimental wiring diagram
The excitation winding had four outgoing terminals with taps at 25% and 50% from both ends.The wiring diagram is shown in Fig.5.The DC source was connected to the excitation winding at ends C1 and C4.

Fig.5 Wiring diagram of minor inter-turn short circuit simulation of field winding
A sliding variable resistor was inserted between taps C2 and C3 to reduce the total resistance of the field winding,which simulated the minor inter-turn short-circuit fault of excitation winding.Assuming that the total resistance of the field winding is R, the resistance of the field winding between C2 and C3 is R1, and that of the sliding varistor is R0.When R1 and R0 are connected in parallel, the total resistance of the field winding becomes r (r<R).The difference between R and r, R′, is the resistance of the simulated metallic short circuit part of the field winding.
The turns of the metallic short circuit coils could be changed by adjusting the resistance of the slide rheostat R0;the larger the resistance of the slide rheostat, the smaller the number of metallic short-circuit-fault turns.The ratio of short-circuit coil turns is defined as
where zk is the number of turns in the metallic short-circuit part of the field winding, Z is the total number of turns in the field winding, and M is the ratio of the turns between C2 and C3 to the total number of turns in the field winding.
The experiment was conducted under the normal and fault conditions of the generator with different loads, and the collected data of the physical quantities are listed in Table 2.The data acquisition frequency was 5000 Hz.
2.2 Network training
When the generator was operated under normal conditions, the active power was changed from 1 kW to 2 kW,and the physical quantities were measured (Table 2).To ensure the richness of the training dataset and reduce the amount of input as much as possible, 10000 data points were extracted as the network training samples.
The number of particles, number of small groups,number of particle-optimization steps, and value range of the particle position and velocity, were set.The position of the particle was the parameter to be determined in the network.The parameters to be determined for GRU-CNN were the number of network layers, number of neurons in each layer of the GRU network, number of filters in the convolutional layer, network training batch, and relevant time in the past.The positions of the particles were continuously updated,and the updated parameters were substituted into the network to calculate the RMSE.The global optimal solution calculated by the IPSO is the optimal parameter selection for the network.
According to the above steps, the parameters of GRUCNN were optimized.the number of particles was 20, the number of small particle populations was 5, the number of particle swarm iterations was 100, and the number of network training was 25 times.
The parameter optimization results of the GRUCNN excitation current subnetwork and reactive power subnetwork are shown in Fig.6.As can be seen from the figure, the IPSO had stronger optimization capability.
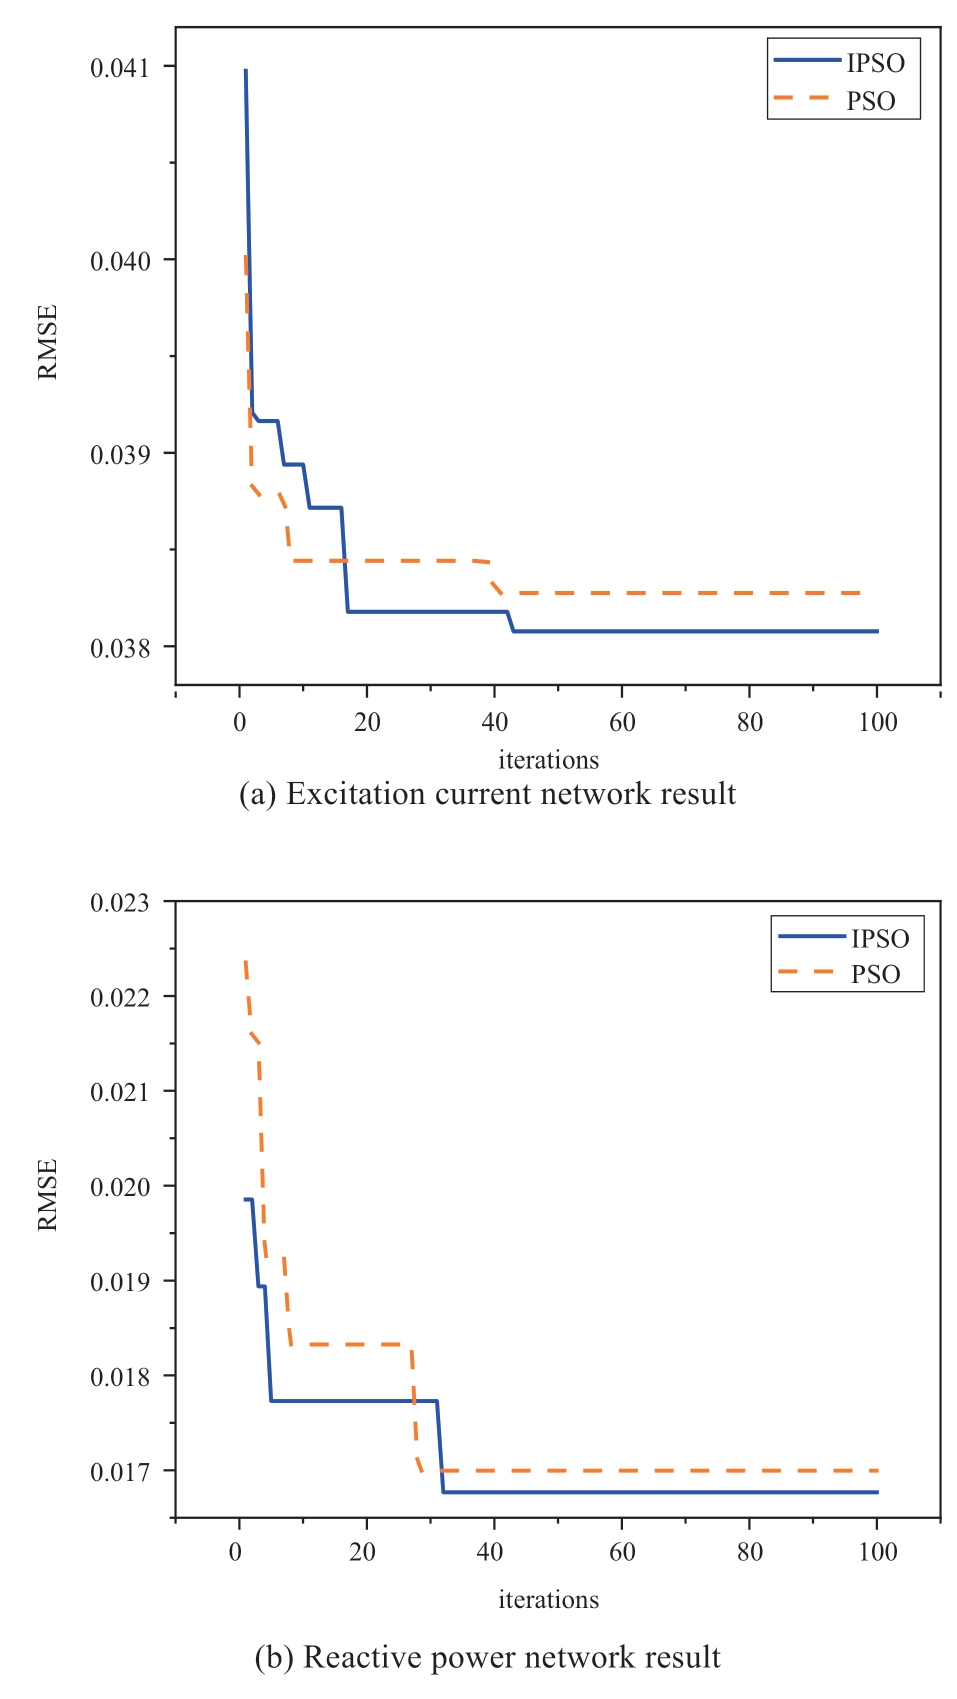
Fig.6 Network parameters optimization results
The optimization result of GRU-CNN is as follows.The number of units of the two-layer GRU network was 31 and 34, the number of convolutional layer filters was 16, the relevant time in the past was 1, and the number of training batches of the network was 176.A schematic of the network structure is shown in Fig.7.After determining the network structure of the model, it was trained.
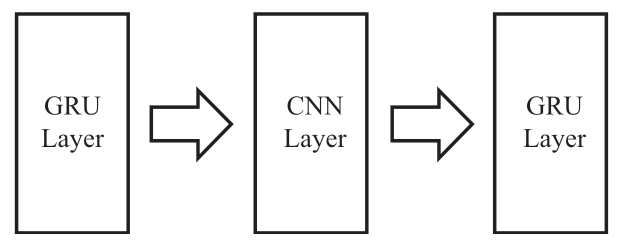
Fig.7 Network structure
The data of the generator in normal operation were input into sub-networks GRU_1 and GRU_2.The training loss values are shown in Fig.8.For clarity, some of the training results are presented in Fig.9 and 10.
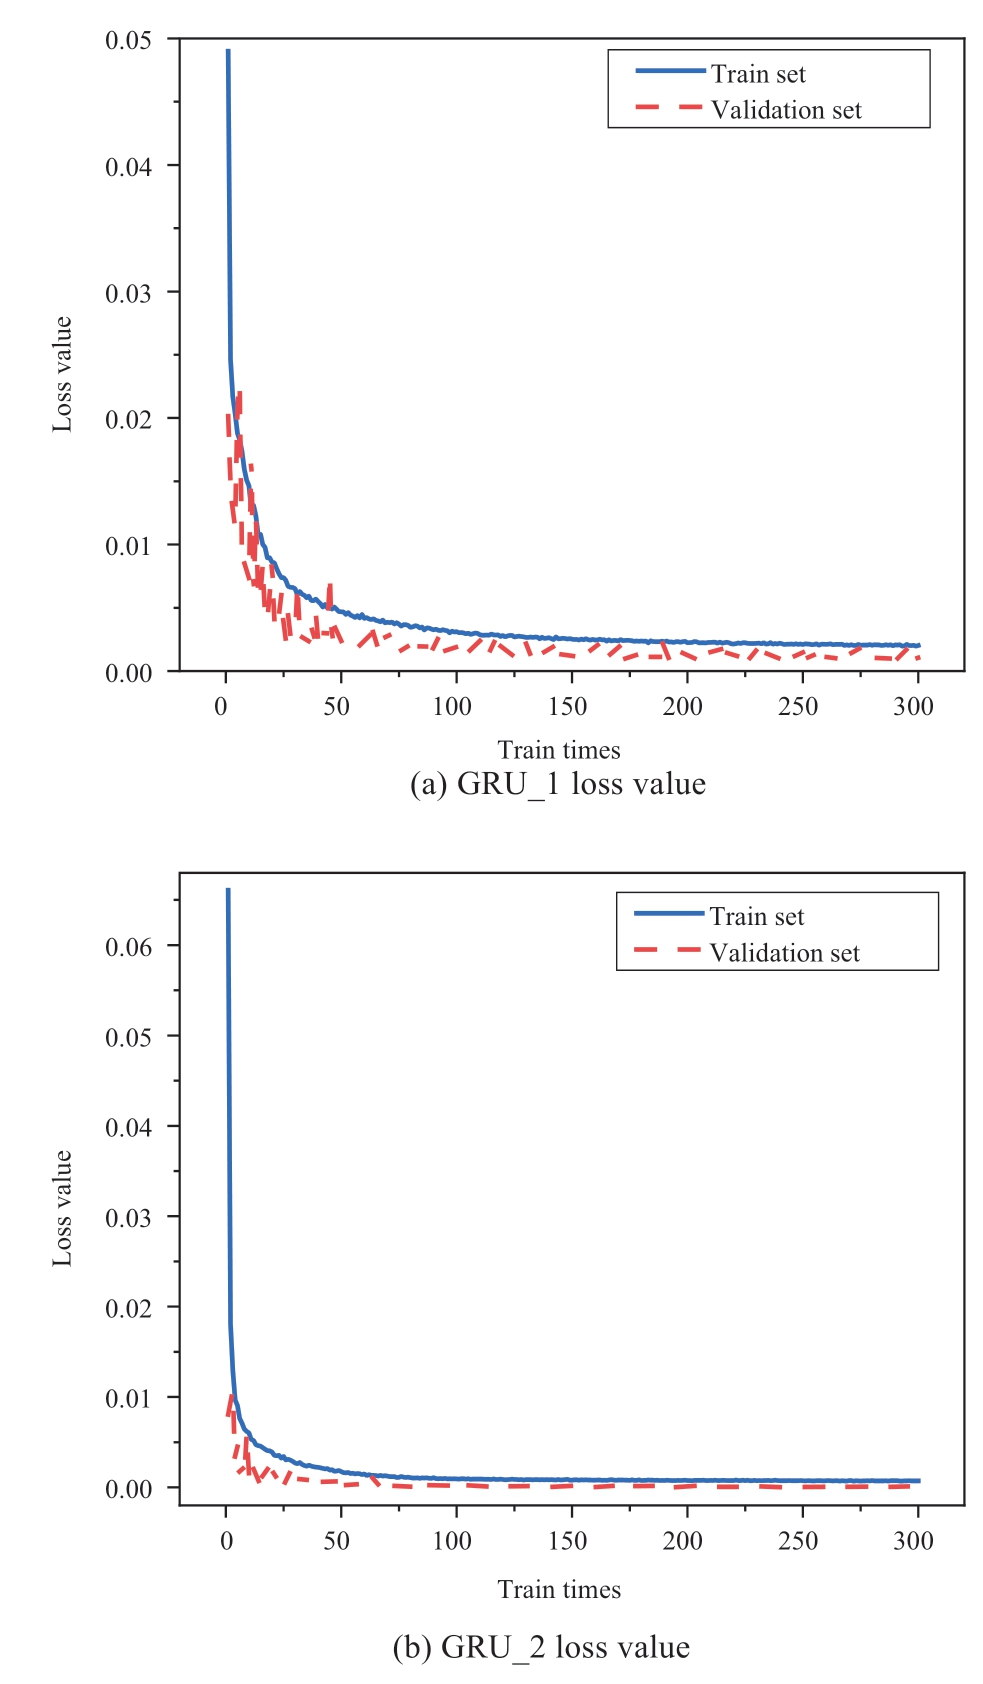
Fig.8 Network train loss
As shown in Fig.8, the loss values of GRU_1 and GRU_2 reduced to stable values.The training error of the training and validation sets tended to be stable, which indicates that the network had no overfitting phenomenon and had good generalization ability.It can be observed from Fig.9 and 10 that the fitting result of the network is acceptable.
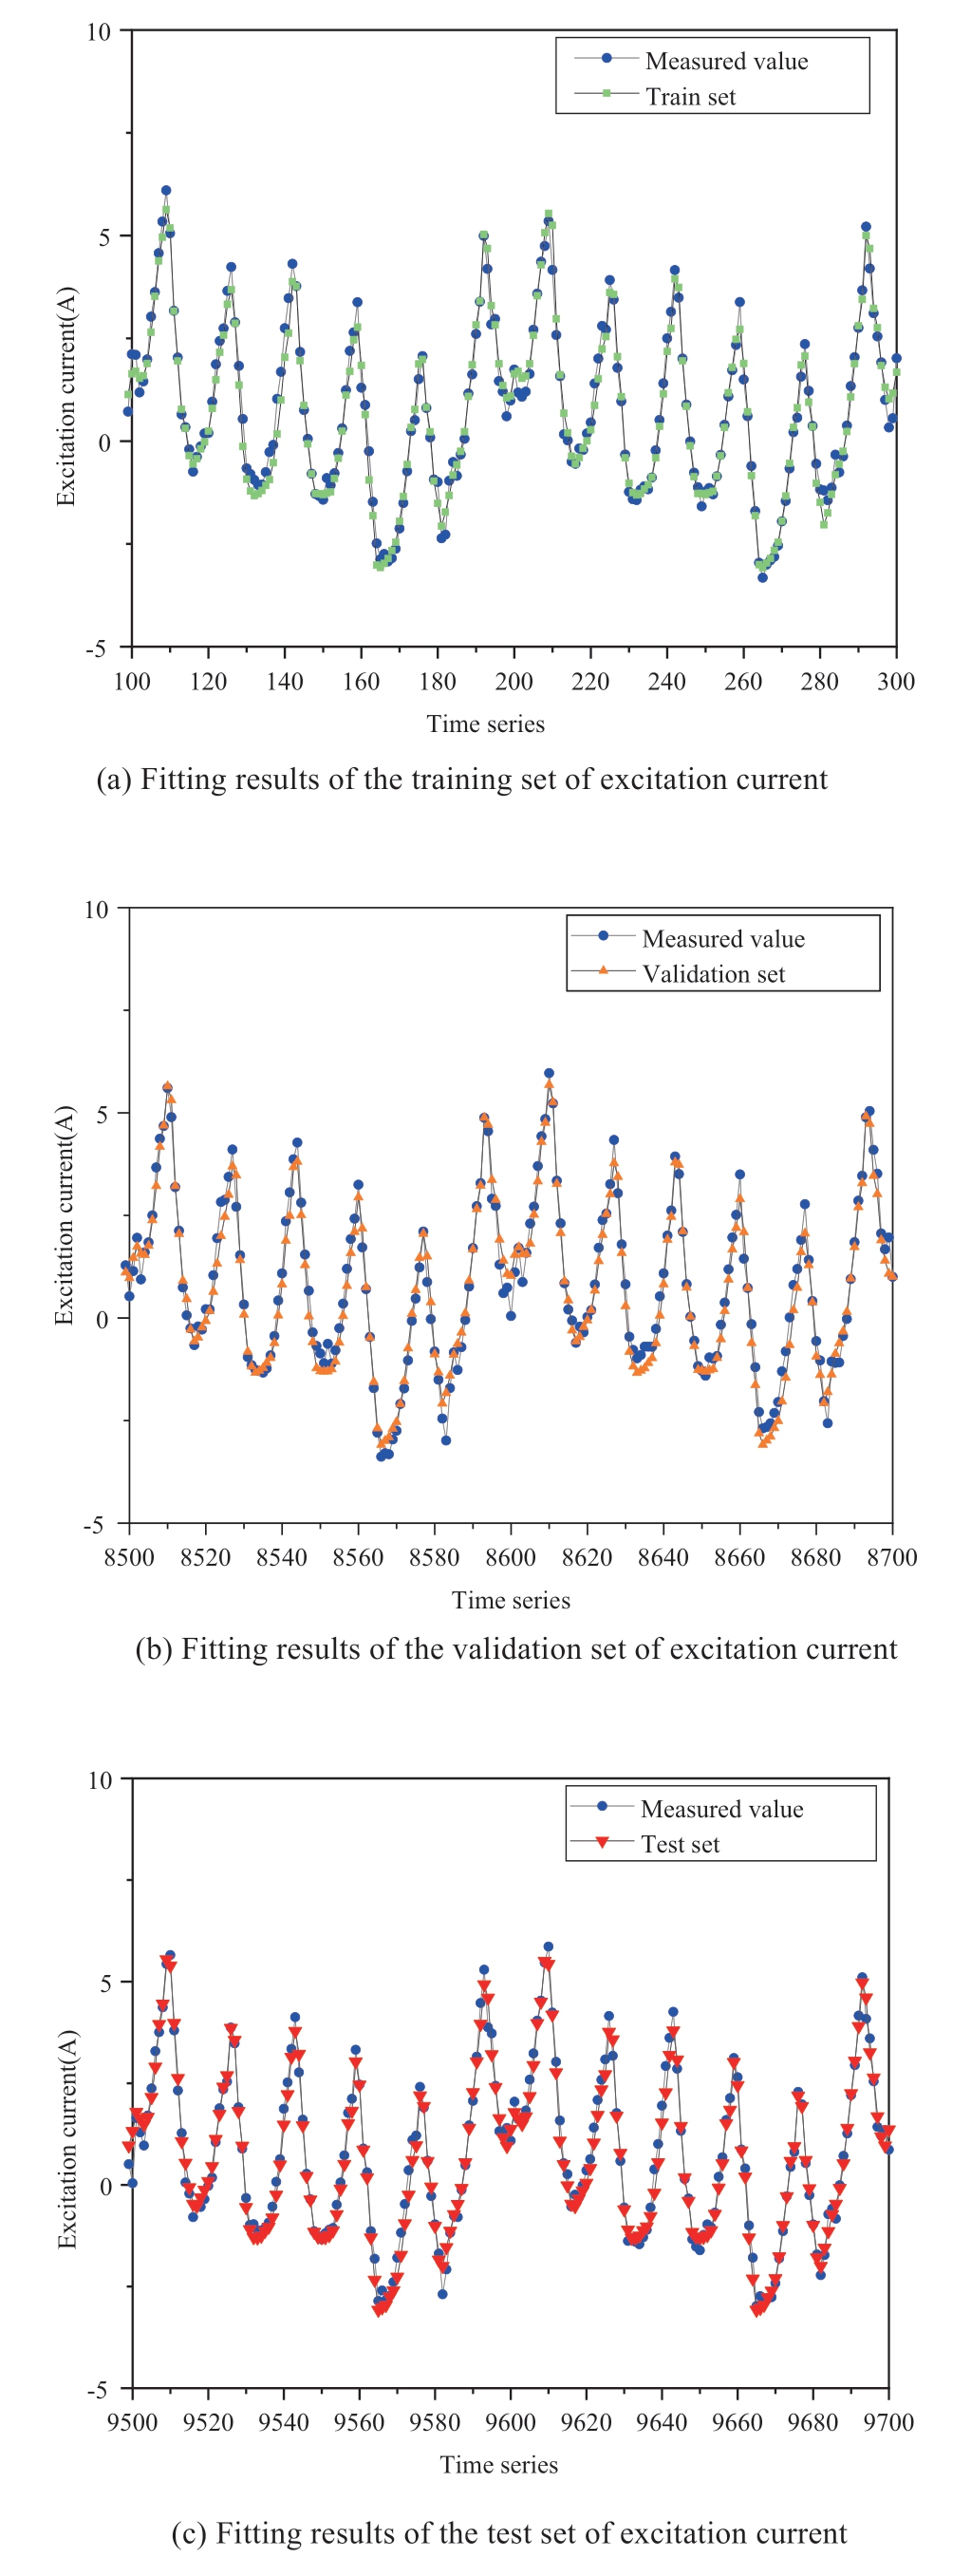
Fig.9 Excitation current training results
Furthermore, we replaced the CNN layer in the GRUCNN with a GRU layer having same number of neurons as the CNN to form a GRU network with the same structure as the GRU-CNN.A performance comparison of the two models is presented in Table 3.
Table 3 Comparison of GRU and GRU-CNN

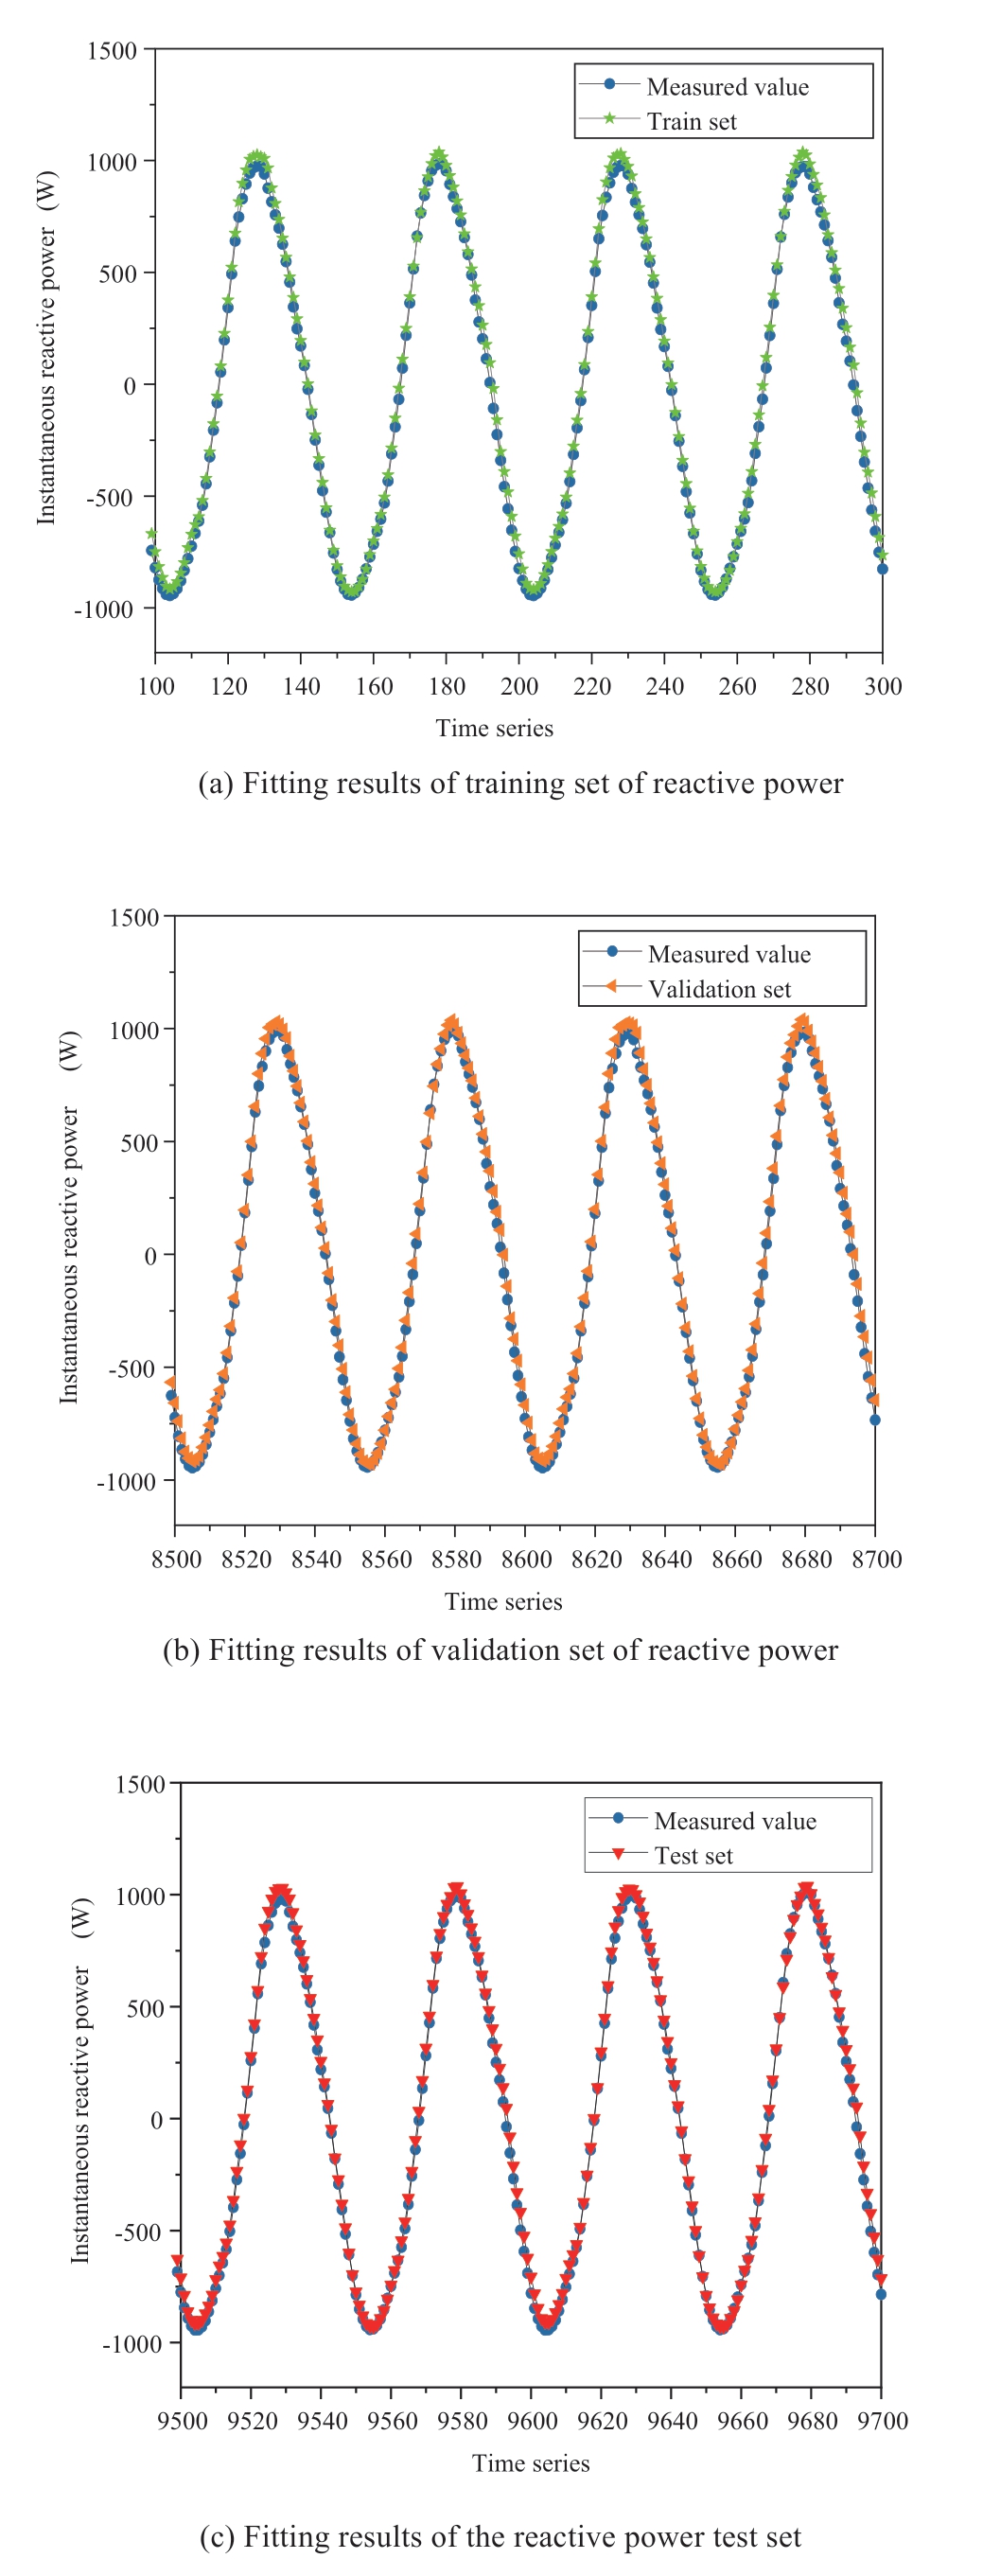
Fig.10 Instantaneous reactive power training result
It can be seen that the GRU-CNN has fewer network parameters, higher network accuracy, and faster training speed than the GRU network with the same structure.This is because the construction method of the CNN is locally connected, and the weights are shared.
2.3 Fault warning threshold
The data of the generator under normal conditions were input into the trained GRU-CNN network to calculate the total offset distance.The calculation results are shown in the Fig.11.
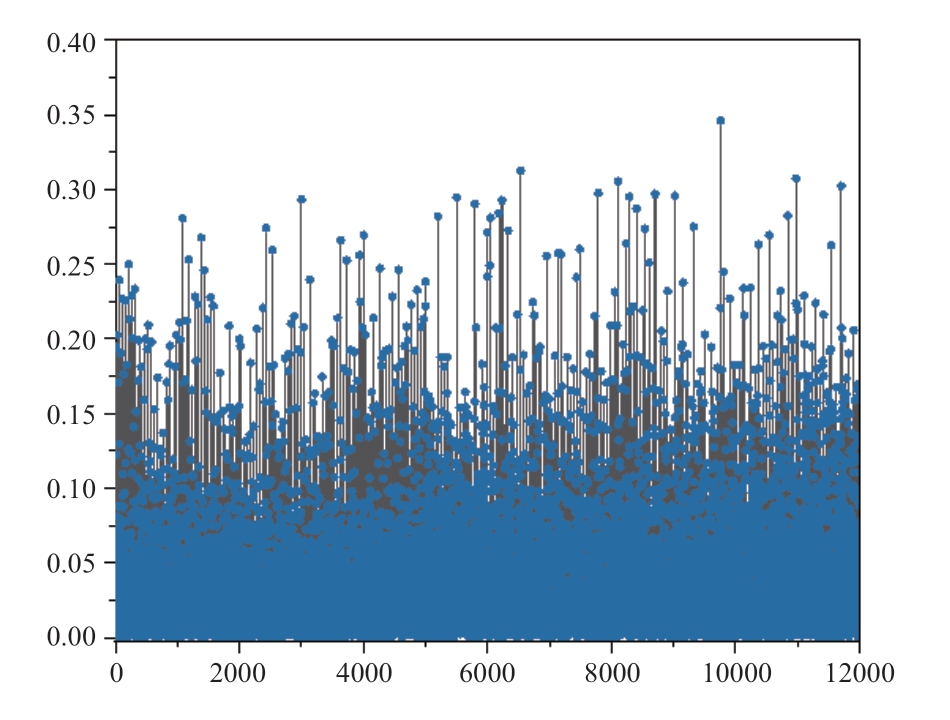
Fig.11 Offset distance under normal conditions
It can be seen that most of the offset distances between the predicted values and the actual measured values are below 0.01.However, there is still a small part of the offset distance which is relatively large.The existence of these abnormal offset distances affects the sensitivity of the fault warning.Therefore, to ensure the sensitivity of fault diagnosis, these abnormal values must be filtered out.
The Box-plot was used to filter the outlier offset distances in the excitation current and reactive power.The Box-plot is shown in Fig.12.
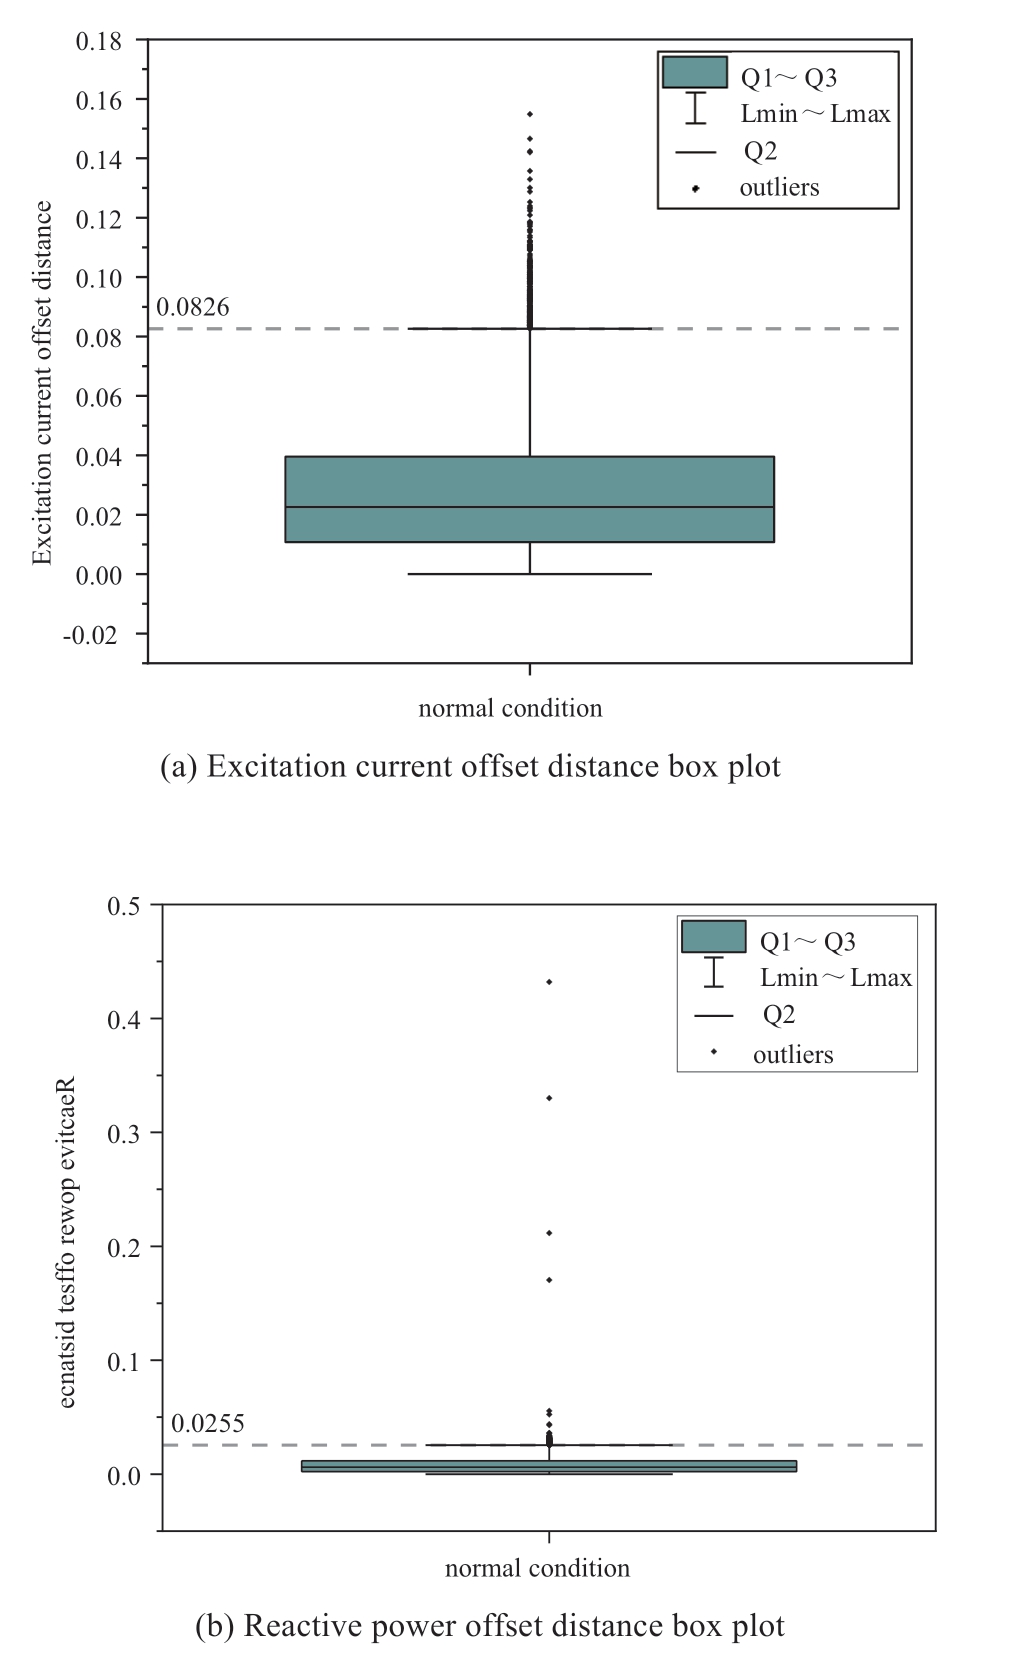
Fig.12 Outlier filtering result diagram
After filtering out the outliers, the anti-entropy weight values of the excitation current and reactive power offset distance was calculated as wH={0.499,0.501}.According to the anti-entropy weight, the offset distance of the excitation current and the offset distance of the reactive power were fused to obtain the total offset distance of the generator under normal conditions.Taking twice the mean of the total offset distance as the fault warning threshold, the calculated fault-warning threshold was 0.034.The fault warning time was selected as 0.02 s, that is, 100 data points were taken as a group.The fault-warning value was selected as 80%, i.e.,the rotor inter-turn fault could be diagnosed when the fault warning ratio was greater than 80%.
2.4 Fault diagnosis
To verify the proposed method in rotor inter-turn fault diagnosis, a rotor inter-turn fault experiment was conducted.The sliding varistor R0 in Fig.5 was selected to be 1.1 kΩ,and the ratio of the inter-turn short circuit of the exciting winding was calculated to be 0.29% from (19).
When the generator operated under fault condition, the physical quantities in Table 2 during the change in active power from 1 kW to 2 kW were measured.In the case of generator failure, 48,000 data samples when the load was 1 kW, 1.5 kW, and 2 kW were used to confirm the reliability of the proposed fault- diagnosis method.
The data under the fault situation were input into the trained GRU-CNN to calculate the total offset distance, and the fault was diagnosed according to the above method.Fig.13 shows the fault offset distances for partial samples for each load.The fault-warning ratio and diagnostic accuracy are listed in Table 4.
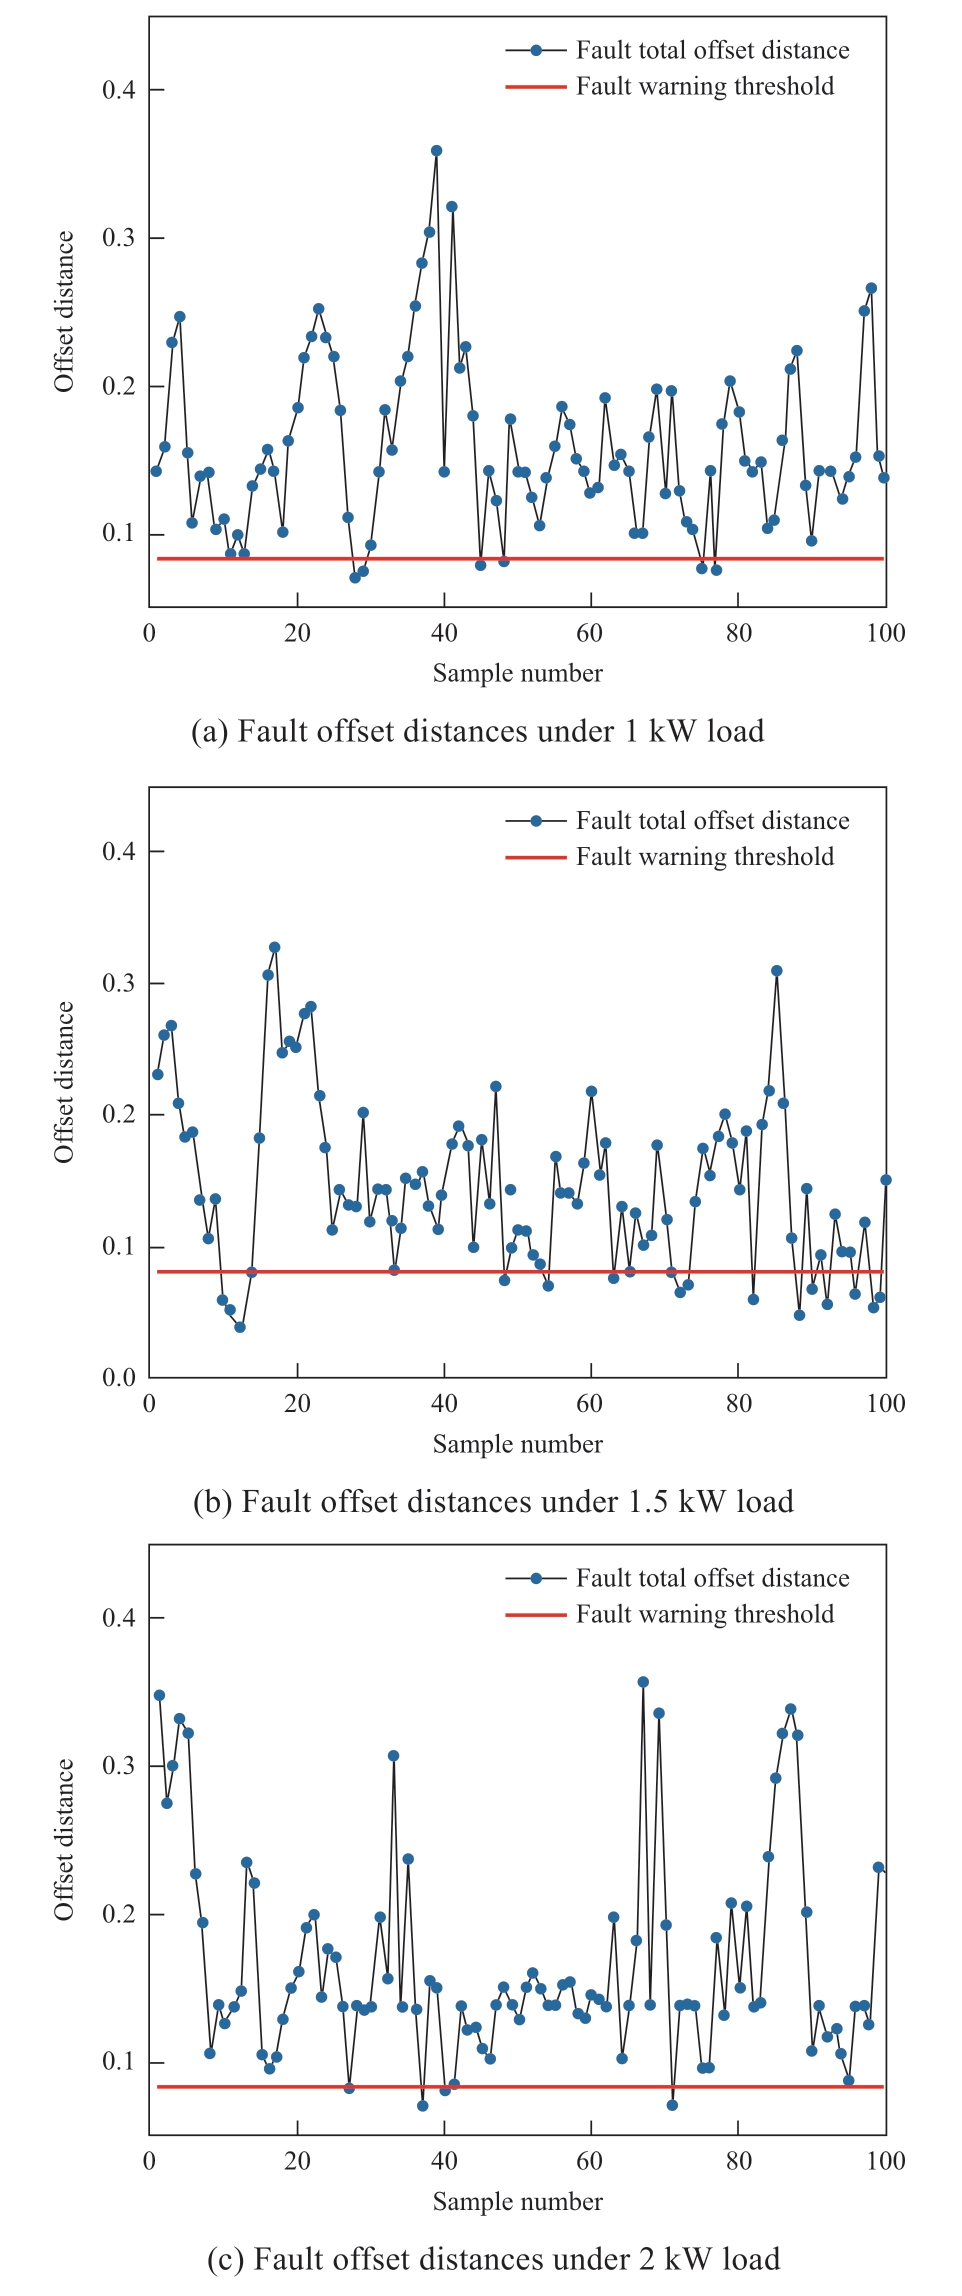
Fig.13 Fault offset distances of partial sample groups under three loads
Table 4 Fault diagnosis results

As can be seen from Table 4, within the load range covered by the training set, the GRU-CNN has a high diagnostic accuracy for the slight inter-turn short-circuit fault of the excitation winding of the generator.
3 Conclusion
A fault-warning system based on GRU-CNN for the interturn short circuit of the excitation winding of a synchronous generator was proposed.Improved particle swarm optimization (IPSO) was proposed to determine the structural parameters of the GRU-CNN.The total offset distance from the fusion of the offset distances of the excitation current and reactive power was considered as the fault-warning threshold.The fault-warning time and fault warning ratio were used to avoid misdiagnosis and increase the warning reliability of early faults in the inter-turn short circuit of the excitation winding of the synchronous generator.The proposed fault-warning model only needs to collect the data under normal operation of the generator,which is easy to obtain for the training network.Therefore,the proposed fault-warning method has a wider range of applications.
Declaration of Competing Interest
We declare that we have no conflict of interest.
References
[1] Song MQ (2016) Research on fault of turn to turn short circuit of rotor winding of large hydro generator.Paper presented at the 6th International conference on machinery, materials, environment,biotechnology and computer, China, 11 June 2016
[2] Wang L, Li YG, Li JQ (2018) Diagnosis of inter-turn short circuit of synchronous generator rotor winding based on volterra kernel identification.Energies.doi: 10.3390/en11102524
[3] Li YG, Wang L, Ma MH (2019) Diagnosis of rotor winding inter-turn short-circuit of hydro-generator based on no-load curve reverse calculation.IEEJ Transactions on Electrical & Electronic Engineering, 14(1): 130-137
[4] Li TH, Jia BY, Ding B, et al.(2018) Simulation study on interturn short circuit of rotor windings in generator by RSO method.Paper presented at the IEEE International conference on high voltage engineering and application, Athens, Greece, 10-13 Sept 2018
[5] Kalyan KK, Kumar PGS, Malla RK (2016) Diagnosis of rotor winding shorts through signal reflection.Paper presented at the 6th IEEE International conference on power systems (ICPS),New Delhi, INDIA, 4-6 March 2016
[6] Xiao HY, Wang XW, Chen DF (2013) Fault diagnose of rotor winding inter turn short circuit in generator.Applied Mechanics and Materials, 321-324:1290-1294
[7] Sun YG, Hao LL, Wang XH (2011) Math model and fault characteristics of field winding inter-turn short circuit of synchronous generator.Automation of Electric Power Systems,35(6):45-50(in Chinese)
[8] Li JQ, Hou JY, Li HM (2010) Simulation research on field windings inter-turn short circuits fault of turbine generator with no load based on multi-loop model.Paper presented at the 2010 International Conference on Electrical Machines and Systems,Incheon, Korea (South), 10-13 Oct 2010
[9] Li JQ, Wang L (2019) Calculation and analysis of rotor thermal static field for inter-turn short circuit of large hydro-generator excitation winding.Energies, 12(7):1252
[10] Sun YG, Yu XW, Wei K, et al.(2014) A new type of search coil for detecting inter-turn faults in synchronous machines.Proceedings of the CSEE, 34(6):917-924(in Chinese)
[11] Wan ST, He P (2007) Rotor winding inter-turn short circuit fault diagnosis system based on artificial neural network.Paper presented at the 8th International conference on electronic measurement and instruments, Xi’an, China, 16-18 Aug 2007
[12] Li YG, Zhao YJ, Chen L, et al.(2008) Fault diagnosis of rotor winding inter-turn short circuit in turbine-generator based on BP neural network.Paper presented at the 2008 International conference on electrical machines and systems, Wuhan, China,17-20 Oct 2008
[13] Zhao J (2010) Fault diagnosis of inter-turn short-circuit in rotor windings based on artificial intelligence.Paper presented at the 2nd IEEE International conference on information and financial engineering, Chongqing, China, 17-19 Sept 2010
[14] Samuel T, Laurent C, Gérard-André C (2013) Wound-rotor induction generator inter-turn short-circuits diagnosis using a new digital neural network.IEEE Transactions on Industrial Electronics, 60: 4043-4052
[15] Zhang SL, Wang YX, Liu MQ, et al.(2018) name="ref16" style="font-size: 1em; text-align: justify; text-indent: 2em; line-height: 1.8em; margin: 0.5em 0em;">[16] Wang HZ, He KK, Fang LX (2019) Application of deep learning in motor fault diagnosis.Computer Simulation, 36(10): 423-428(in Chinese)
[17] Zhang ZL, Li YJ, Li MH, et al.(2019) Fault diagnosis method of permanent magnet synchronous motor based on depth learning.Computer Applications and Software, 36(10):123-129(in Chinese)
[18] Liu RN, Wang F, Yang BY, et al.(2020) Multiscale kernel based residual convolutional neural network for motor fault diagnosis under nonstationary conditions.IEEE Transactions on Industrial Informatics, 16 (6):3797-3806
[19] Liao GP, Gao W, Yang GJ, et al.(2019) Hydroelectric generating unit fault diagnosis using 1-D convolutional neural network and gated recurrent unit in small hydro.IEEE Sensors Journal,19(20):9352-9363
[20] Yang LX, Zhang ZJ (2021) Wind turbine gearbox failure detection based on SCADA data: a deep learning-based approach.IEEE Transactions on Instrumentation and Measurement,70:3507911
[21] Zhang HL, Wang R, Pan RL, et al.(2020) Imbalanced fault diagnosis of rolling bearing using enhanced generative adversarial networks.IEEE Access, 8:185950- 185963
[22] Liao LX, Köttig F (2016) A hybrid framework combining datadriven and model-based methods for system remaining useful life prediction.Applied Soft Computing, 44:191-199
[23] Hinton GE, Osindero S, Teh YW (2016) A fast learning algorithm for deep belief nets.Neural Computation, 18(7): 1527-1554
[24] Jeong CS, Ryu KH, Lee JY, et al.(2020) Deep learningbased tourism recommendation system using social network analysis.International Journal of Internet, Broadcasting and Communication, 12(2): 113-119
[25] Srinivas SM, Kishalay M (2020) Deep learning based system identification of industrial integrated grinding circuits.Powder Technology, 360(15): 921-936
[26] Jo J, Kung J, Lee Y (2020) Approximate LSTM computing for energy-efficient speech recognition.Electronics, 9(12): 2004
[27] Li YG, Li HM, Zhao H (2003) The new criterion on inter turn short-circuit fault diagnose of steam turbine generator rotor windings.Proceedings of the CSEE, 6:112-116+169(in Chinese)
[28] Wang AD, Wang JH, Li JQ, et al.(2019) Early faults and characteristics of large capacity non-salient pole synchronous electric machines.Paper presented at the International conference on advances in materials, mechanical and manufacturing, Beijing,China, 22-24 March 2019
[29] Hu W, Li ZS (2007) A simpler and more effective particle swarm optimization algorithm.Journal of Software, 4: 861-868
[30] Li JX, Wang FX, Ke DL, et al.(2021) Weighting factors design of model predictive control for permanent magnet synchronous machine using particle swarm optimization.Transactions of China Electrotechnical Society, 36(01):50-59(in Chinese)
[31] Zhang GR, Chen XR, Yan LH (2017) APF optimization allocation based on isolated niche particle swarm algorithm.Journal of Electronic Measurement and Instrumentation,31(2):208-215(in Chinese)
[32] Wang X, Wang E (2018) Evaluation of smart grid based on AHPanti-entropy weight method.IPPTA: Quarterly Journal of Indian Pulp and Paper Technical Association, 30(8):478-481
Received: September 18 2021/ Accepted: November 30 2021/ Published:April 25 2022
Junqing Li
junqing03@163.com
Jing Liu
751779291@qq.com
Yating Chen
839945787@qq.com
2096-5117/© 2022 Global Energy Interconnection Development and Cooperation Organization.Production and hosting by Elsevier B.V.on behalf of KeAi Communications Co., Ltd.This is an open access article under the CC BY-NC-ND license (http: //creativecommons.org/licenses/by-nc-nd/4.0/ ).
Biographies
Junqing Li received her Bachelor’s and Master’s degree at Hebei University of Technology in 1989 and 1992, respectively,and her Ph.D.at the North China Electric Power University in 2006.She is now working as a professor at the North China Electric Power University.Her research interests include motor and system analysis, fault diagnosis of electrical equipment, and the application of big-data analysis in new energy power systems.

Jing Liu received her Bachelor’s degree in Electrical Engineering from the North China Electric Power University, Baoding, 2019, and she is currently pursuing her Master’s degree at the same university.Her research interest is fault diagnosis.

Yating Chen received her Bachelor’s and Master’s degrees in Electrical Engineering from the North China Electric Power University, Baoding, China, in 2018 and 2021,respectively.Her research interests include big-data analysis and fault warnings.
(Editor Yanbo Wang)
