0 Introduction
Weather changes have a significant impact on human production activities.Weather forecasting is an important means to ensure safety of lives and property.Further, it also ensures an orderly and efficient conduct of social production[1].The development of modern society and people’s life cannot leave the use of electricity, and fossil energy as the main body of the old power system, under the background of the “double carbon” have to speed up the pace of reform, distributed renewable energy power generation become the important choice to solve the problem of energy crisis[2-3], renewable energy power generation in the increasing proportion of the world's electricity[4-6].To replace fossil energy with clean energy and form a new power system with clean energy as the main body[7].Pv power generation prediction model based on historical operation data and historical meteorological data has been widely used, among which weather factors have the greatest influence on PV system and pv power generation forecast amount.Wind power generation has the same volatility as PV power generation, and it is also a mature renewable energy generation technology[8].Wind power prediction technology has become one of the effective solutions that is used to increase the output of wind farms.At this stage, for short-term power prediction of wind farms,NWP methods are adopted.Generally, the NWP resolution provided by the meteorological department is in tens of square kilometers, which cannot meet the requirements for direct calculation of wind farm power.It is necessary to rely on existing technologies to improve the resolution of NWP.This is to ensure that it can accurately predict the weather conditions at a certain point in the wind farm[9].Statistical downscaling and Regional Climate Models (RCMs), i.e.,dynamic downscaling are some common methods used to solve the conversion of meteorological models from low to high resolution.Dynamic downscaling has the advantages of clear physical meaning.It is not affected by observational data.However, the primary disadvantages of its application are that it involves a huge amount of calculation and also, the simulation and configuration remain unchanged[10].Additionally, its timeliness and accuracy need to be further improved.With the development of computer and detection technologies, the application of weather radars and weather satellites has significantly enriched the available data for weather forecasting.The advantages of statistical downscaling have gradually emerged.The statistical downscaling method is flexible and there are a variety of techniques that may be used.However, there is no method that can clearly capture the relationship between low-resolution and high-resolution NWP [11].Scher’s research shows that deep learning networks can successfully simulate the evolution of weather patterns over time when they are provided with sufficient climate model data [12].This discovery is an important step towards purely style="font-size: 1em; text-align: justify; text-indent: 2em; line-height: 1.8em; margin: 0.5em 0em;">In this paper, artificial intelligence NWP is mainly based on the idea of super resolution reconstruction in the domain of computer vision.Early super-resolution reconstruction methods are generally based on sparsecoding-based methods.The experiment in SRCNN proposed by Chao Dong et al.proves that this method has greater accuracy [14].Therefore, CNN is widely used to achieve super-resolution reconstruction of images.This article is based on the SRCNN method.We integrated the hybrid down-sampling skip-connection (DSC) /multi-scale(MS) model proposed by Kai Fukami et al.and have made improvements to these models [15, 16, 17].In the context of a given wind turbine hub height position, it realizes low-resolution NWP downscaling to a high-resolution NWP.It improves the wind speed forecast accuracy of the wind farm.
1 Convolutional Neural Network
Convolutional Network [18], also known as Convolutional Neural Network (CNN), is a neural network specially used to process data with a similar grid structure.It has the characteristics of translation invariance.This makes CNN the first choice for artificial intelligence in spatial data applications [19].Generally, a CNN consists of input layers,convolution layers, and pooling layers, which are also known as subsampling layers, upsampling layers, and fully connected layers, respectively.The introduction of convolution computation enables CNN to have two characteristics of weight sharing and connection sparsity [20-21].
1.1 Convolutional layer
The convolution layer is responsible for extracting image features.Convolution is a special linear operation.
Convolution operations are usually represented by *.In convolutional networks, x is usually called input; ω is the kernel function, also known as weight; b is bias; and y is the feature map.In machine learning, the weight of the convolutional layer is a parameter obtained through continuous learning and optimization of data.The operation process of the convolutional layer is shown in Fig.1.
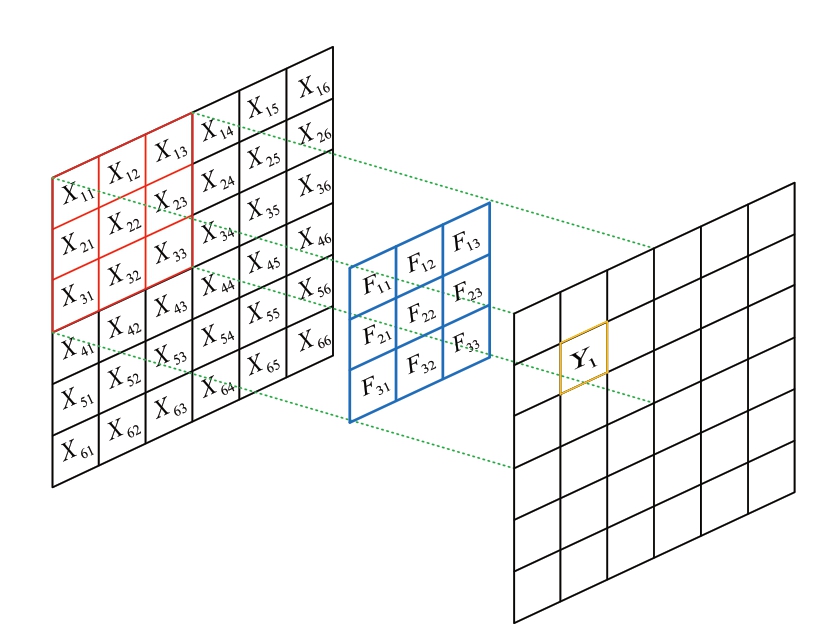
Fig.1 Schematic diagram of image convolution operation

Convolution uses a sliding window from left to right and top to bottom to multiply and add the corresponding positions.The above-mentioned process of convolution operation embodies the idea of sparse connectivity and parameter sharing.Sparse connection is realized by sliding the point multiplication of the convolution kernel on the original image.The size of the convolution kernel is significantly smaller than the size of the input image.After the convolution operation, the meaningful special points on the original image are extracted, in order to reduce the storage of a large number of parameters.Parameter sharing refers to the practice where only one convolution kernel is required to slide over the entire image when a layer of image is input.In this scenario, merely one convolution kernel is required to be learned, instead of learning a parameter separately at each position of the image.The existence of the convolution layer enables the data in the original feature graph to be grouped and aggregated, and avoids the over-fitting problem caused by the participation of a large number of irrelevant parameters in training through weight sharing and sparse connection[22].
1.2 Pooling layer
The pooling layer is generally located between consecutive convolutional layers.This further compresses the amount of data and parameters while preserving its main features.The main function of pooling layer is to remove some redundant information on the premise of keeping the invariance of features, extract important features,namely feature re-extraction, and achieve data dimension reduction[23].The max pooling function is often used in the pooling layer [24].As shown in Fig.2, maximum pooling is to move the image with a fixed sampling area size, and return the maximum value in each area.
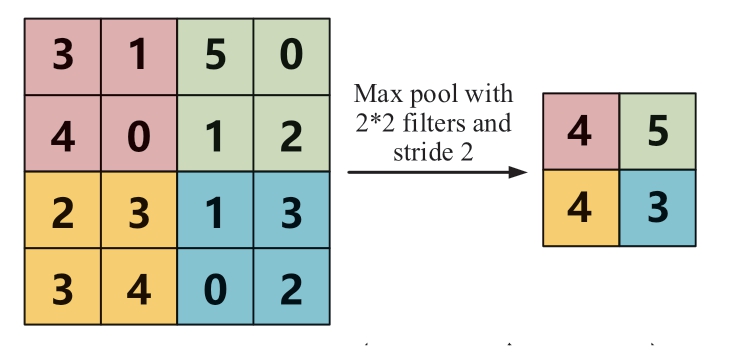
Fig.2 Schematic diagram of the maximum pooling function operation
1.3 Upsampling layer
The upsampling layer enlarges the original image or restores the convolved image.Commonly used methods include bilinear interpolation, transposed convolution,upsampling and others [25, 26, 27].Upsampling can be understood as the inverse process of pooling.Filling a certain area with a certain value on the enlarged image affects the quality of the image.However, as shown in Fig.3, it enlarges some of the subtle features of the image, which is conducive to the subsequent convolution extraction.
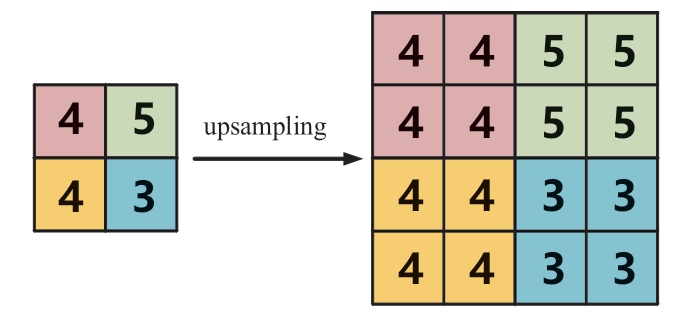
Fig.3 Schematic diagram of upsampling operation
2 CNN downscaling model construction
The overall flow chart of the CNN downscaling model is shown in Fig.4.Specific details are provided in each section below.
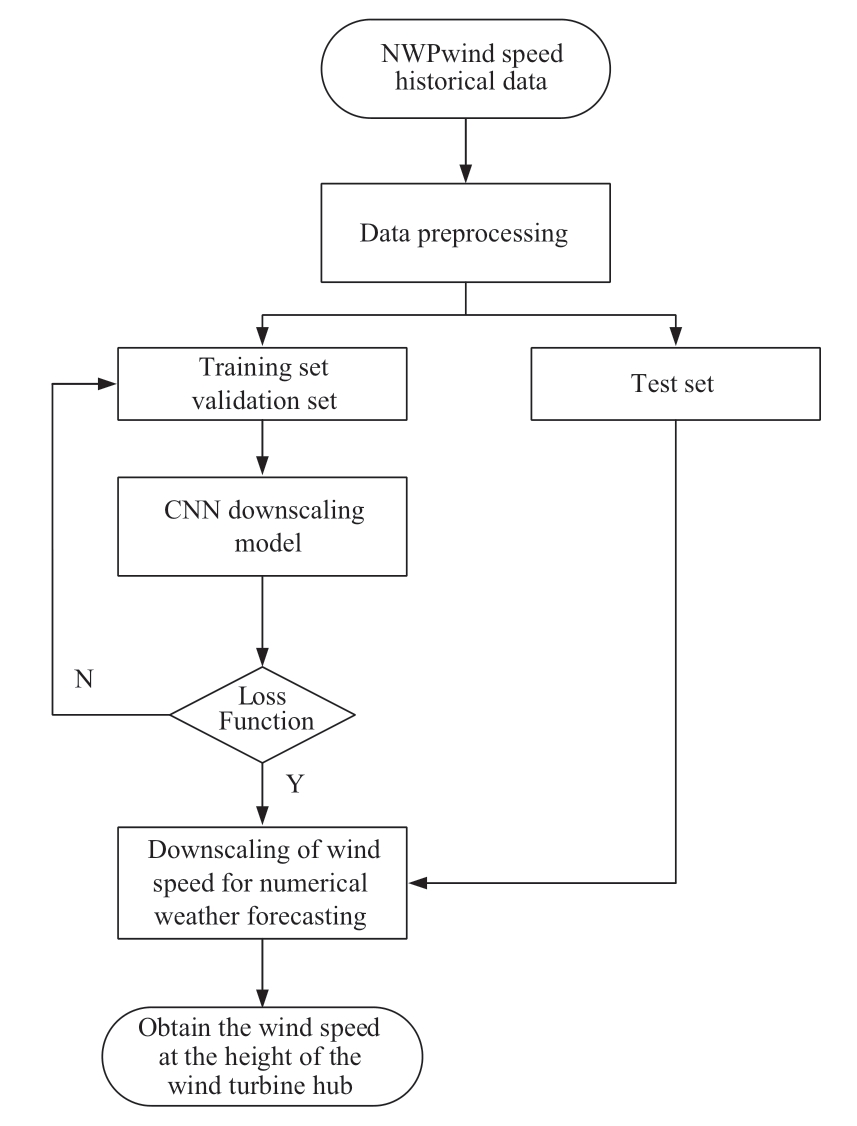
Fig.4 CNN downscaling model construction flowchart
2.1 Data preprocessing
The data is divided into training set, validation set and test set.The training and validation sets are used to determine the model, and the test set is used for model evaluation [28].When the model is trained, the input is the grid point value of the NWP, while he measured wind speed at the height of the wind turbine hub is the output.Therefore, when the data is preprocessed, the data of the NWP and the wind speed of the actual wind turbine are both related and are different.When read in, NWP data is four-dimensional data.However, wind turbines, are onedimensional data.First, it is necessary to reduce the data dimension of the NWP to three dimensions and then store it in three index dimensions: time, longitude and latitude.Data of the NWP and the wind speed data of the wind turbine are aligned according to the same time list.This is followed by separately checking the NWP data set and the wind turbine wind speed data set.Once this is done, the time intersection common to these two is derived.The null positions of the two types of data are evaluated.In order to ensure the sufficiency of data while training the model, the times of the two types of data with null values are not deleted.Until this step, the time index alignment of input and output data and the processing of missing values are completed.Wind speed data of the NWP stores the wind speed vectors in the longitude direction (U) and the latitude direction(V) separately.When the first step of data processing is completed, wind speed synthesis is required.The wind speed synthesis equation is:
Our NWP data has two values at 0:00 UTC (8:00 AM Beijing time) and 12:00 (8:00 PM Beijing time).The forecast wind speed closer to the time of the wind turbine should be selected.Therefore, NWP synthetic wind speed and wind turbine wind speed index the same data at a particular time.Due to the limitation of the actual data set,the wind turbine only has data for the first 10 days of each month.The last two days of each month, i.e., the 9th and 10th data are saved separately as the test set.Data from the first eight days are saved as the training set and validation set.While saving the training set and validation set data,it is necessary to shuffle the NWP synthetic wind speed and wind turbine wind speed in the same random order, in order to ensure the uniformity of the data distribution of the training and validation sets.
2.2 CNN Model
The CNN downscaling model is composed of convolutional layers, pooling layers, up-sampling layers,and fusion layers [29].A fully connected layer is added at the end.Generally, as the convolutional layers are continuously superimposed, the edge data is continuously lost, and the image size reduces.The NWP grid in the calculation example covers the entire wind farm area.The image characteristics cannot be fully learned because the area itself is small, thus making it impossible to increase the multi-layer convolutional layer.The padding in the convolution is designated as same, in order to not discard the original image information [30].This ensures that the input of the deeper convolutional layer can still maintain a sufficiently large amount of information.Residual network is fused with multi-scale competitive convolutional neural network in order to extract more information from the original image, in the process of model construction.The schematic diagram of the network model structure is shown in Fig.5.In Fig.5, the green triangle depicts the upsampling layer.The orange triangle is the pooling layer and the red connection line represents the jump connection, in order to increase the depth of the convolutional neural network.
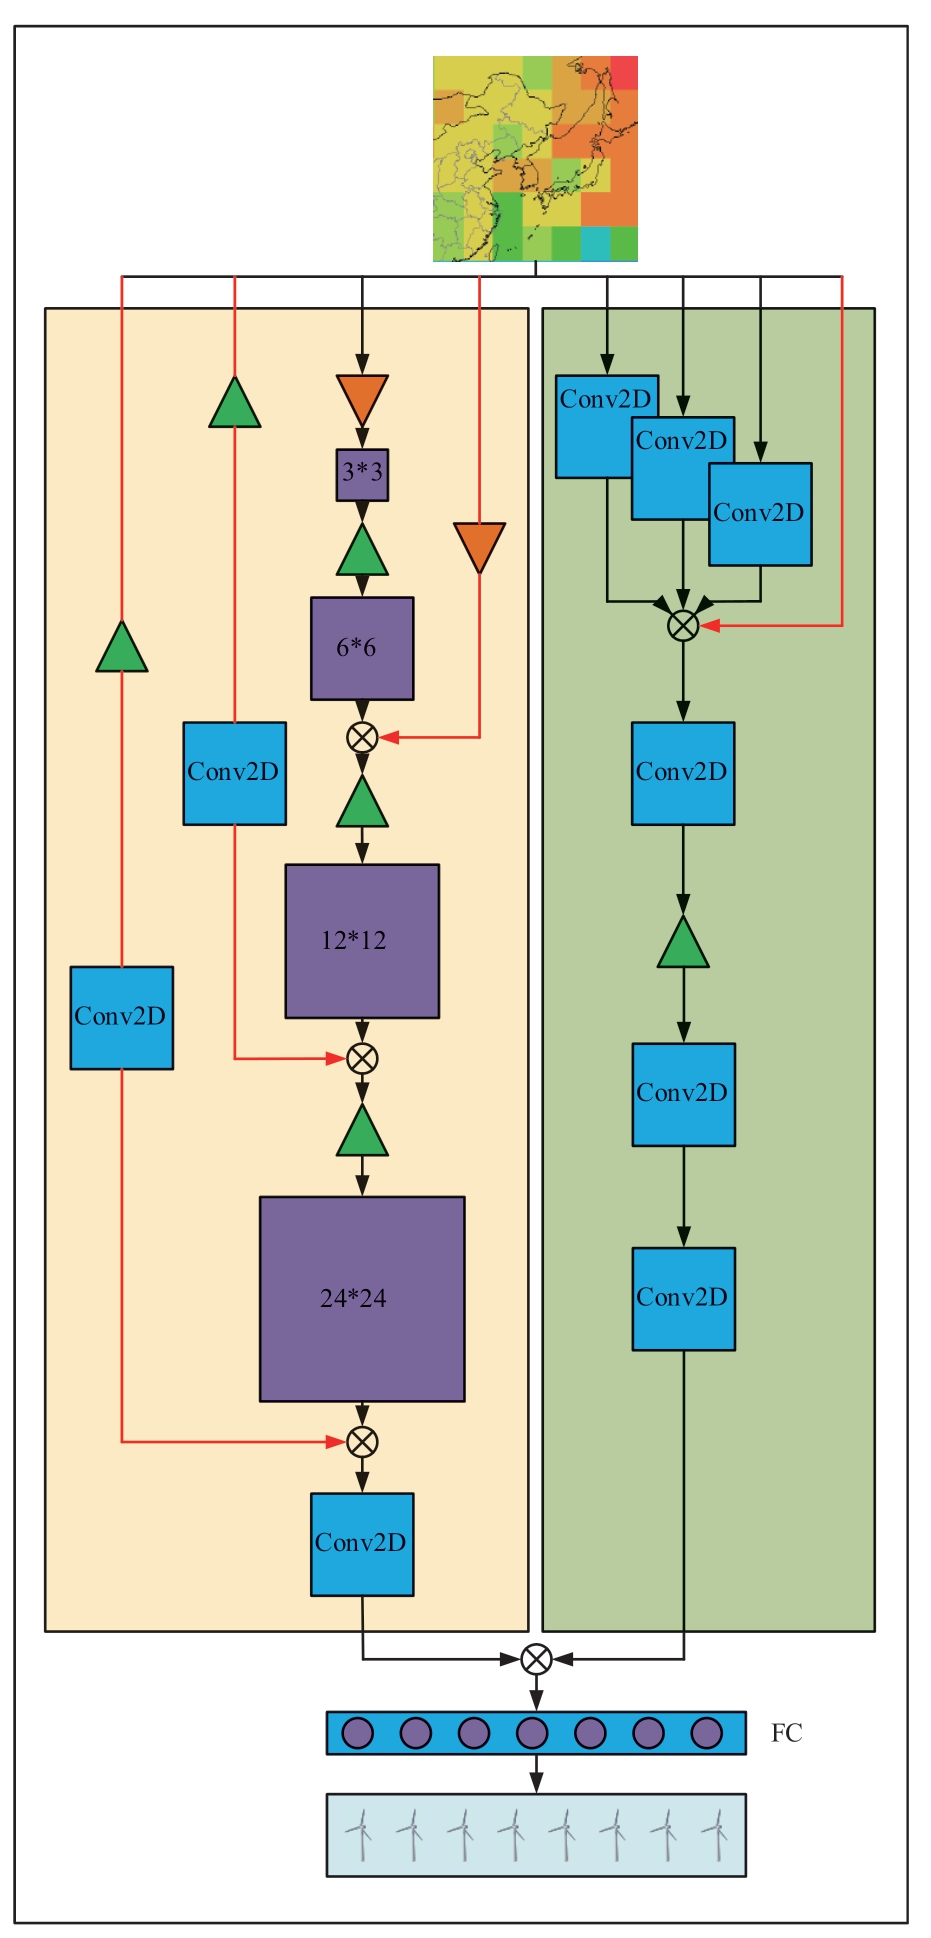
Fig.5 CNN downscaling model structure diagram
2.3 Model evaluation
For machine learning regression tasks, the commonly used evaluation indicators include root mean square error(RMSE), mean square error (MSE), mean absolute error(MAE) and others [31, 32].RMSE is the square root of the ratio of the sum of squares of deviations between the observations and the true values to the number of observations.RMSE is often used to measure the performance of wind speed forecasting.The overall wind speed forecast is more accurate in case of smaller rms error [33].

Where f is the algorithm model, D is the data set, m is the total number of samples in the data set D, xi is the input of the i sample, and yi is the label of the i sample.
3 Analysis of numerical results
In this paper, the proposed super-resolution reconstruction technology is used to verify the downscaling of wind speed of a NWP model to the height of the hub of the wind turbine.We have relied on data collected at a wind farm in Northern China to analyze the calculation example.
The test set of the model has used 9th and 10th of each month as the dates for numerical weather prediction.The NWP model predicts today’s weather conditions from data of the previous day.Therefore, the NWP on the 10th of the month is obtained from the data collected on 9th.Drawing an analogy, if the NWP on the 9th needs to be used, the NWP on the 8th would need to be retained.This further reduces the training set data of the model.The NWP timings are 0:00 and 12:00 GMT, which are 8 o’clock in the morning and 8 o’clock in the evening of Beijing time, respectively.The wind speed of each wind turbine measured by the wind farm was recorded based on Beijing time.Hence, the 12 o’clock GMT forecast result was closer to the actual wind speed of the wind farm.Therefore, the actual input of the model selected the NWP after 8 o’clock Beijing time.The first three hours of each prediction result is null because of the problem of the weather forecast data itself.The null value is deleted in the early stage of data preprocessing.In the end, all time indices of the data that can be used are the last hour on the 9th and the whole day on the 10th.The time resolution of NWP is 15 minutes, such that there are a total of 25×4 time points.Fig.8 shows the downscaled wind speed of the NWP output after model training, the wind speed of the original NWP and the measured wind speed at the height of the turbine hub.These are the green, blue, and red polylines in Fig.6, respectively.
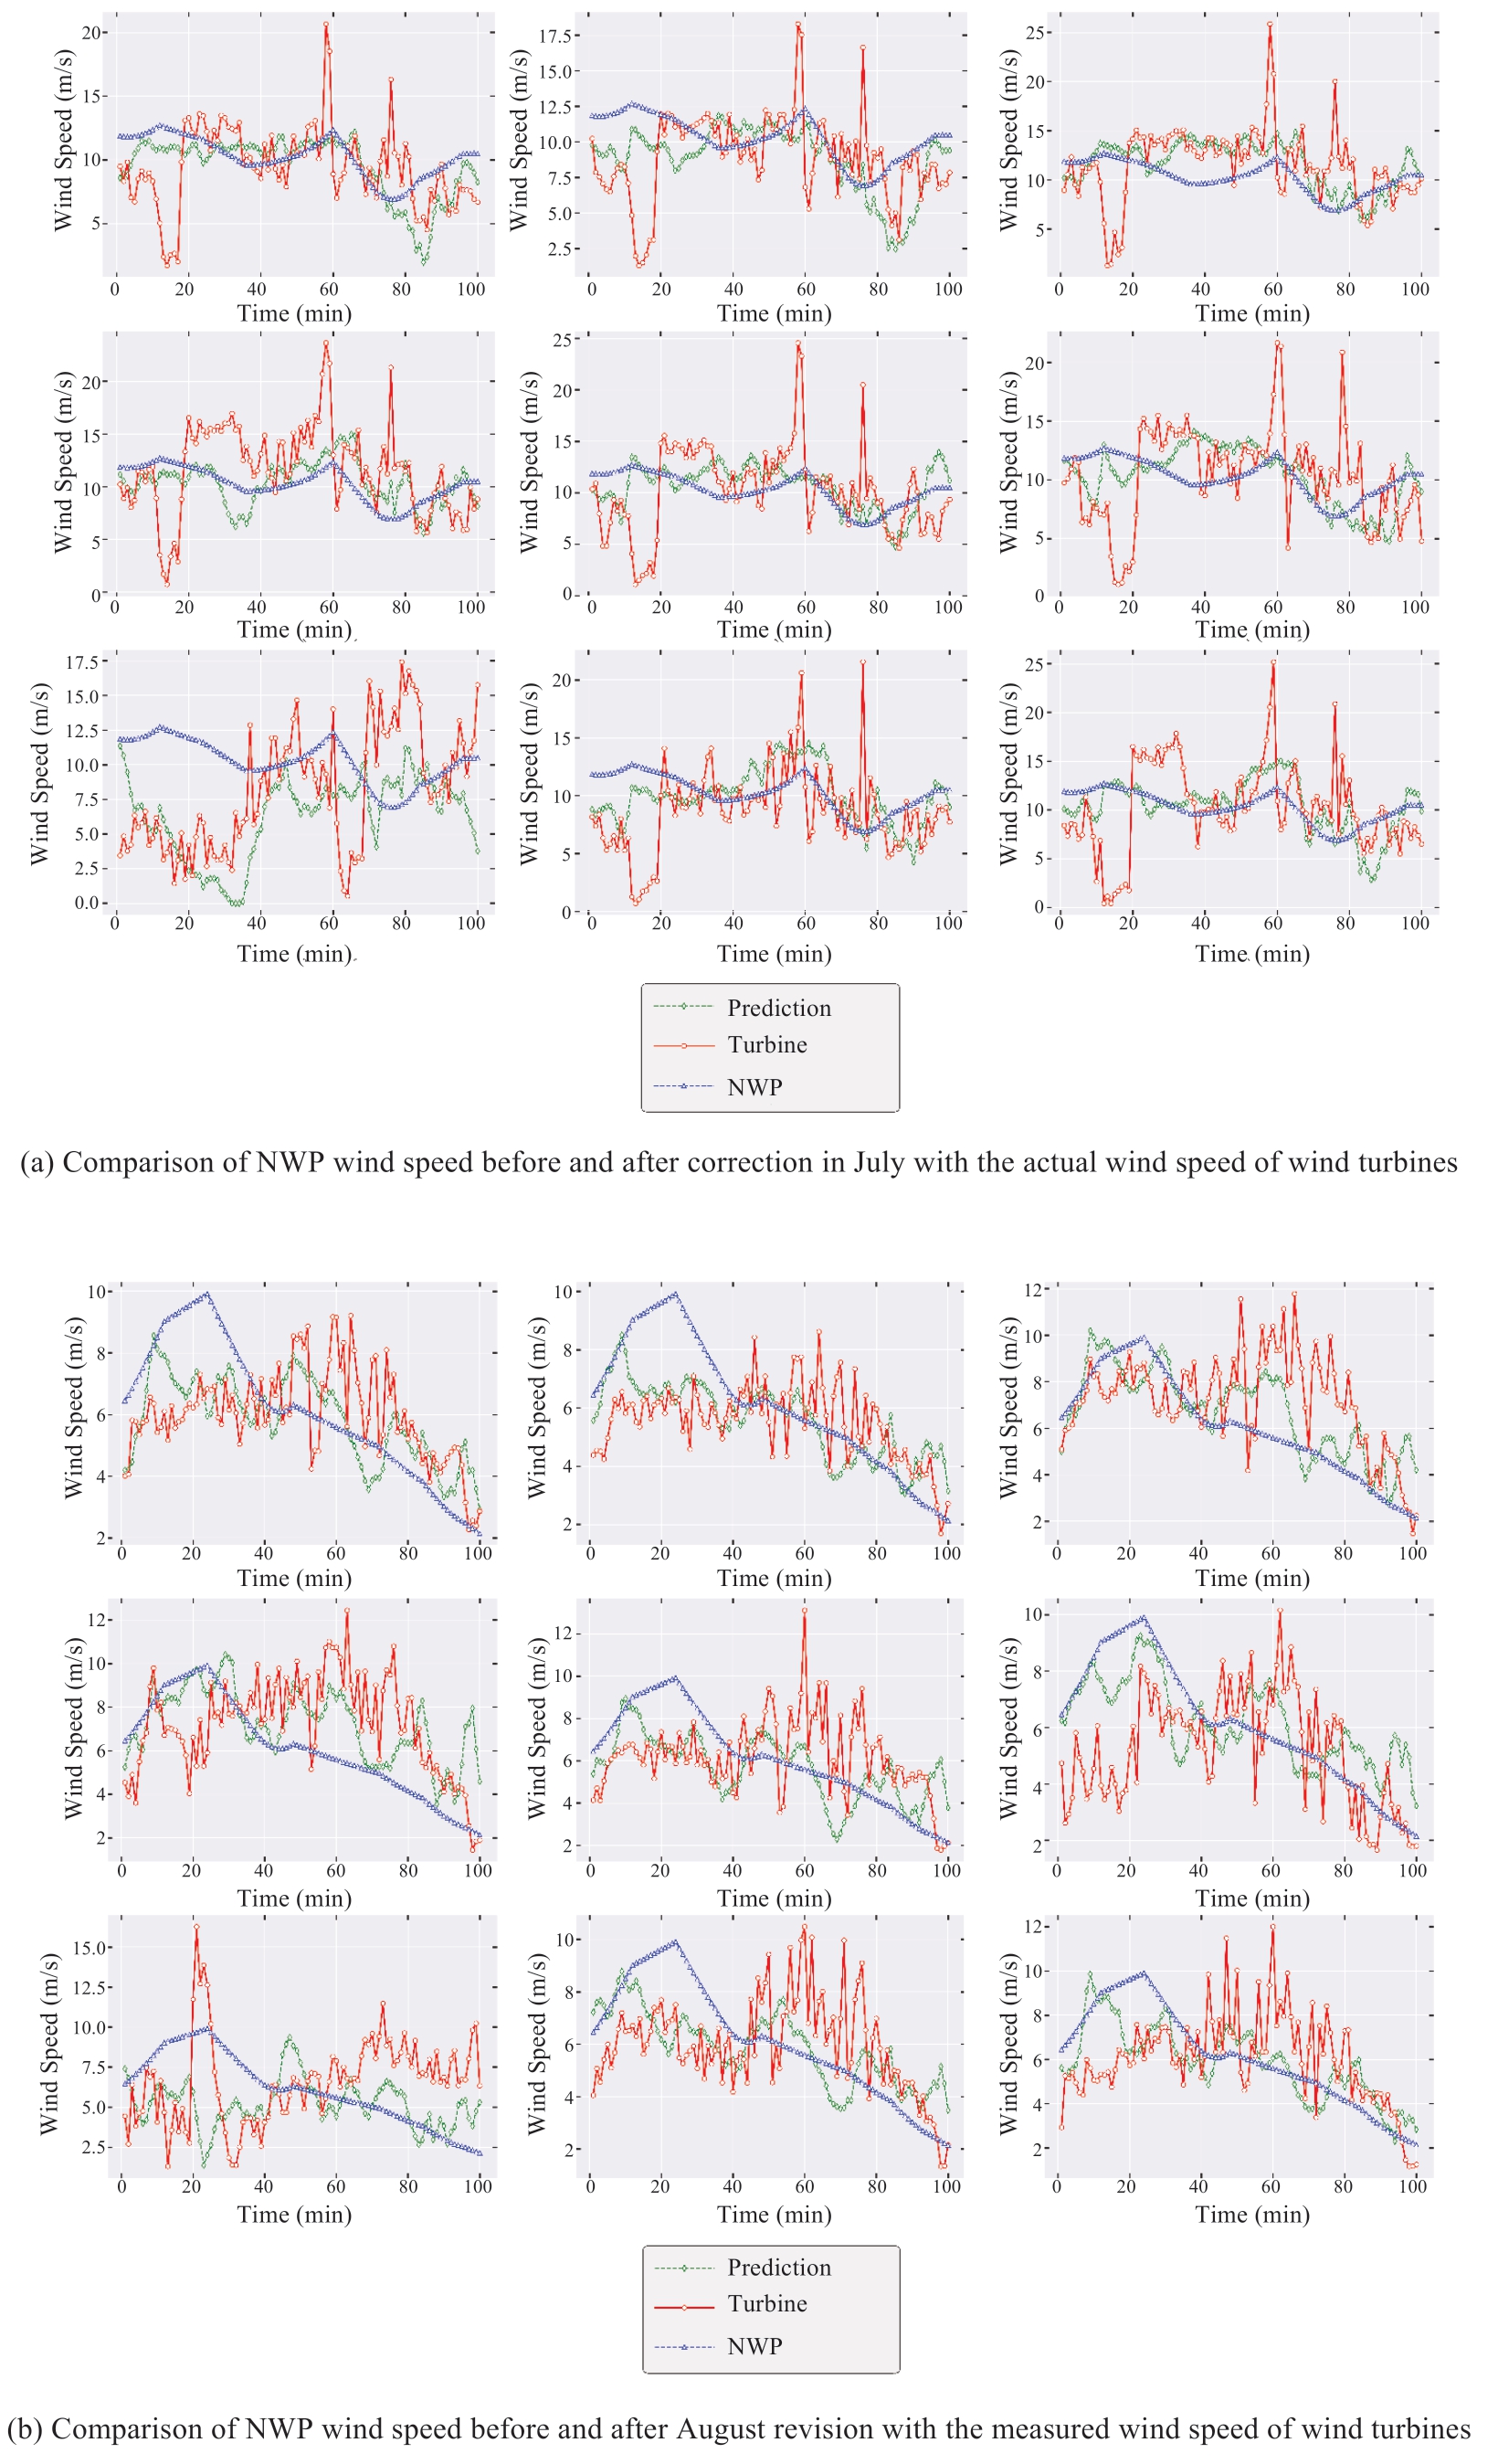
Fig.6 Comparison of NWP wind speed before and after correction with the actual wind speed of wind turbines
The model calculates a total of 12 sets of results.Among these 6 sets of results are better than the pure physical model and 3 sets of calculation results are equivalent to the prediction accuracy of the traditional pure physical model.Two sets of results are not as accurate as the traditional physical model.
Two sets of results that are better than the calculation results of the pure physical model are selected for display.A comparison is made between the wind speed of the NWP with the measured wind speed of the wind turbine.When comparing the wind speed of the NWP before and after introducing correction, it is observed that the NWP wind speed increases once the model is downscaled.The overall trend is closer to the measured wind speeds of the wind turbines.
Table 1 Calculation results of NWP wind speed and measured wind speed RMSE of wind turbines before and after correction in July
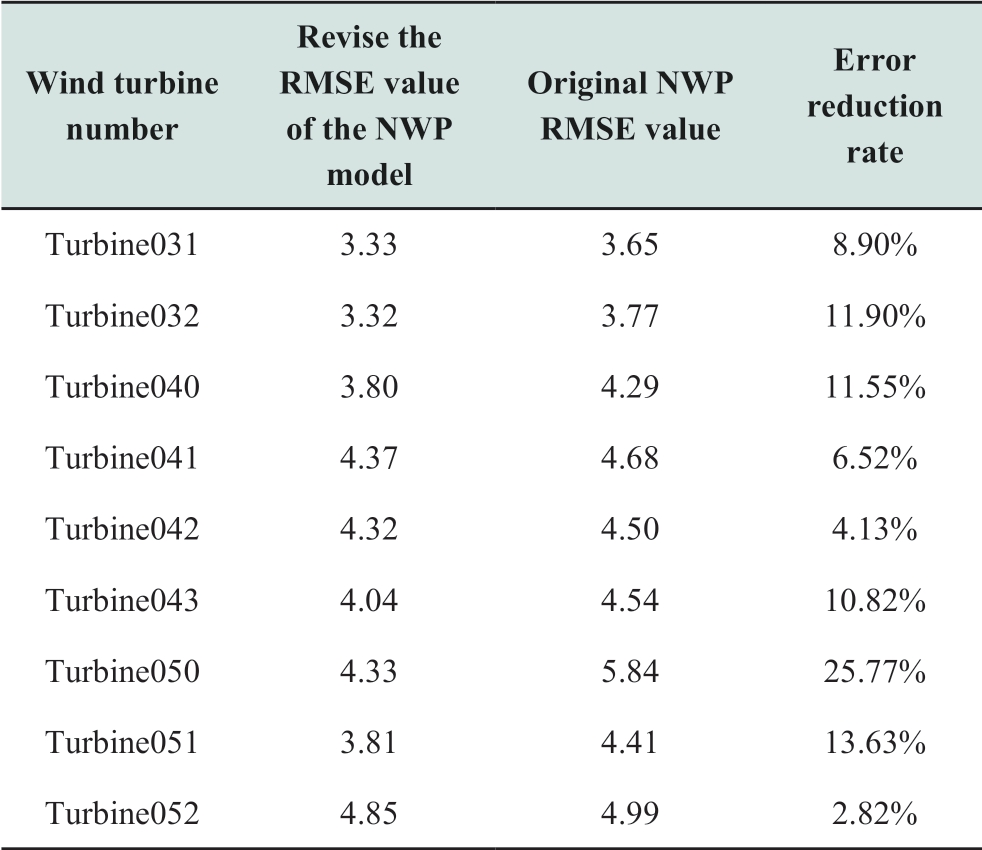
Table 2 Calculation results of NWP wind speed and measured wind speed RMSE of wind turbines before and after correction in August
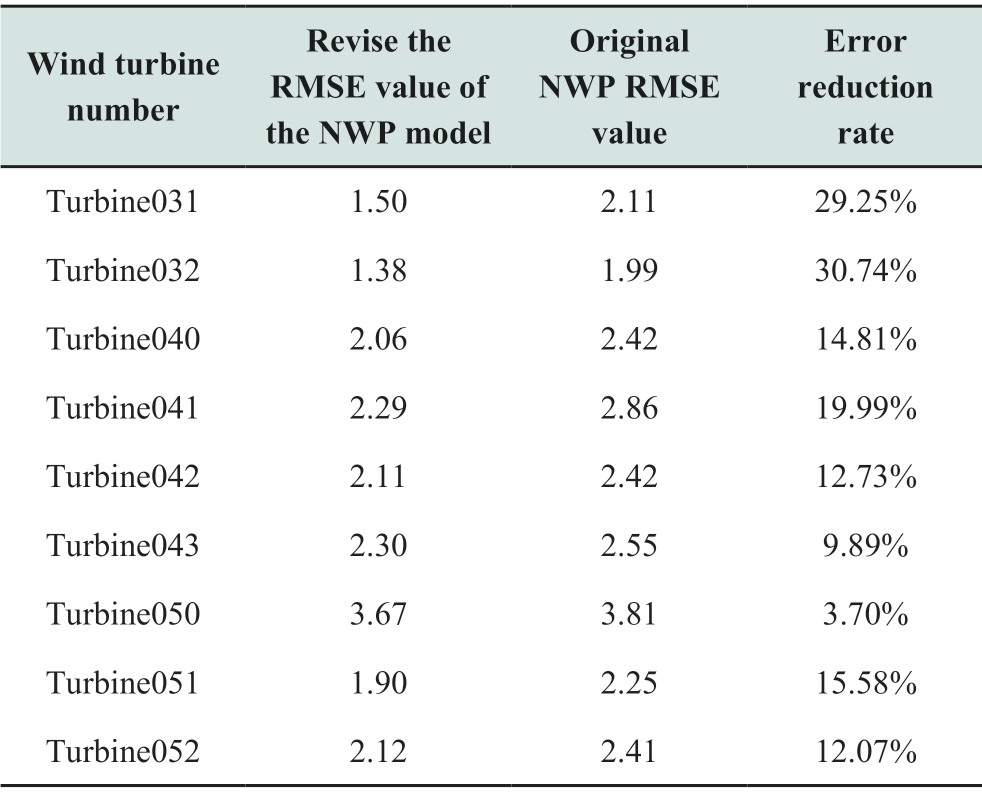
The resolution of the original NWP is rough and the wind turbines of the wind farm that fall near the grid of the original NWP are numbered 031, 032, 040, 041, 042,043, 050, 051, 052.We calculated the RMSE values of the corrected NWP model output and the measured wind speed of the wind turbine, and that of the original NWP and the measured wind speed of the wind turbine.From the calculation results in the above table 1 and table 2, it can be observed that the downscaling of the original NWP to the wind speed at the height of the wind turbine hub is significantly closer to the actual measured wind speed.This has a positive effect on the improvement of the accuracy of wind farm power prediction.
4 Conclusions and Future Work
4.1 Conclusions
The improved downscaling model proposed in this paper is based on super-resolution reconstruction technology.It fuses a residual network with a multi-scale competitive convolutional neural network and performs well in the case analysis.The prediction accuracy of the proposed method is equivalent to that of the traditional pure physical model,and is better than the pure physical model in a few months.The calculation efficiency is improved significantly.The effectiveness and advantages of the proposed method are verified, and traditional NWP models can be supplemented to a certain extent.
4.2 Future Work
The model constructed in this paper needs to be further improved.First, the model training and testing data sets must have more number of data points.The importance of data in deep learning models is self-evident.Second,the input of the present model is solely NWP wind speed.The input of subsequent models should add data such as temperature, air pressure, altitude, latitude and longitude,wind farm topography, and the output should also increase the wind direction angle.NWP with higher resolution and lower computational cost can be calculated in the future if the model can be improved further.
Acknowledgements
This work was supported by the Science and Technology Project of State Grid Corporation of China: Key technology for high-resolution and centralized wind power forecasting for deep-offshore wind power base (No.SGSXDK00YJJS2000879).
Declaration of Competing Interest
We declare that we have no conflict of interest.
References
[1] Sun J, Cao Z, Li H, et al.(2021) Application of Artificial Intelligence Technology to Numerical Weather Prediction.Journal of Applied Meteorological Science, 32(01): 1-11
[2] Hui G, Qing X, Cengkai O (2018) Analysis of the Optimal Control Strategy for Source Network Load with Multitype Distributed Power Source.Electric Power Engineering Technology, 37(04): 21-26
[3] Shi Y H, Liu B (2018) Communication design of renewable energy generation cluster connect to grid based on shared model.Electric Power Information and Communication Technology,16(5): 6-10
[4] Yan H, Huang B B, Hong B W (2018) Block chain:reconfiguration of distributed energy trading architecture for the future market.Electric Power Information and Communication Technology, 16(10): 8-12
[5] Liu C S, Xie Y Y, Wang X F, et al.(2019) IGDT based power dispatch for wind farms participating in power system restoration.Electric Power Engineering Technology, 38(3): 27-33
[6] Chang L, Pang W, Yan B, et al.(2019) Design of renewable energy inter-regional spot market operation support system.Power System Protection and Control, 47(9): 158-165
[7] Tian J, An Y, Jiang J, et al.(2021) Technical Solutions for Decarburization in Context of Carbon Neutrality.Distributed Energy, 6(3): 63-69
[8] Bian H H, Sun J H (2021) Photovoltaic power generation prediction model based on optimized TMY Method-GRNN.Electric Power Engineering Technology, 40(5): 94-99
[9] Liu Y Q, Han S, Hu Y S (2007) Review on Short-term Wind Power Prediction.Modern Electric Power, (05): 6-11
[10] Liu Y H, Guo W D, Feng J M, et al.(2011) A Summary of Methods for Statistical Downscaling of Meteorological Data.Advances in Earth Science, 26(08): 837-847
[11] Vandal T, Kodra E, Ganguly S, et al.(2017) DeepSD: generating high resolution climate change projections through single image super-resolution.Proceedings of the 23rd ACM SIGKDD International Conference on Knowledge Discovery and Data Mining: 1663-1672
[12] Scher S(2018) Toward name="ref13" style="font-size: 1em; text-align: justify; text-indent: 2em; line-height: 1.8em; margin: 0.5em 0em;">[13] Keys R (1981) Cubic convolution interpolation for digital image processing.IEEE Transactions on Acoustics, Speech, and Signal Processing, 29(6): 1153-1160
[14] Garland J, Gregg D (2017) Low complexity multiply accumulate unit for weight-sharing convolutional neural networks.IEEE Computer Architecture Letters, 16(2): 132-135
[15] Zhang S Z, Wang J J, Tao X Y, et al.(2017) Constructing Deep Sparse Coding Network for image classification.Pattern Recognition, 64: 130-140
[16] Dong C, Loy C C, He K M, et al.(2016) Image super-resolution using deep convolutional networks.IEEE Transactions on Pattern Analysis and Machine Intelligence, 38(2): 295-307
[17] He K M, Zhang X Y, Ren S Q, et al.(2016) Deep residual learning for image recognition.2016 IEEE Conference on Computer Vision and Pattern Recognition (CVPR), 770-778
[18] Du X F, Qu X B, He Y F, et al.(2018) Single image superresolution based on multi-scale competitive convolutional neural network.Sensors, 18(3): 789
[19] Fukami K, Fukagata K, Taira K (2019) Super-resolution reconstruction of turbulent flows with machine learning.Journal of Fluid Mechanics, 870: 106-120
[20] LeCun Y (1989) Generalization and network design strategies.Connectionism in perspective, 19: 143-155
[21] Liu X H, Kong X D (2021) Fast load flow calculation of N-2 contingency based on convolutional neural network.Electric Power Engineering Technology, 40(4): 95-100
[22] Tang G, Yu Y P, Qin C, et al.(2021) Day-ahead interval prediction of bus load based on CNN-LSTM quantile regression.Electric Power Engineering Technology, 40(4): 123-129
[23] Rasp S, Dueben P D, Scher S, et al.(2020) WeatherBench: A benchmark data set for name="ref24" style="font-size: 1em; text-align: justify; text-indent: 2em; line-height: 1.8em; margin: 0.5em 0em;">[24] Zhou Y T, Chellappa R (1988) Computation of optical flow using a neural network.IEEE 1988 International Conference on Neural Networks.San Diego, CA, USA.IEEE, 71-78
[25] Kirkland E J (2010) Bilinear interpolation.Boston, MA:Advanced Computing in Electron Microscopy, 261-263
[26] Im D, Han D, Choi S, et al.(2019) DT-CNN: Dilated and transposed convolution neural network accelerator for real-time image segmentation on mobile devices.2019 IEEE International Symposium on Circuits and Systems.Sapporo, Japan.IEEE, 1-5
[27] Kopf J, Cohen M F, Lischinski D, et al.(2007) Joint bilateral upsampling.ACM Transactions on Graphics, 26(3): 96
[28] Guyon I (1997) A scaling law for the validation-set training-set size ratio.AT&T Bell Laboratories, 1-11
[29] Higashiyama K, Fujimoto Y, Hayashi Y (2018) Feature extraction of NWP data for wind power forecasting using 3D-convolutional neural networks.Energy Procedia, 155: 350-358
[30] Wiranata A, Wibowo S A, Patmasari R, et al.(2018) Investigation of padding schemes for faster R-CNN on vehicle detection.2018 International Conference on Control, Electronics, Renewable Energy and Communications (ICCEREC).Bandung, Indonesia.IEEE, 208-212
[31] Chai T, Draxler R R (2014) Root mean square error (RMSE)or mean absolute error (MAE)? -Arguments against avoiding RMSE in the literature.Geoscientific Model Development, 7(3):1247-1250
[32] Allen D M (1971) Mean Square error of prediction as a criterion for selecting variables.Technometrics, 13(3): 469-475
[33] Sun Q D, Jiao R L, Xia J J, et al.(2019) Adjusting wind speed prediction of numerical weather forecast model based on machine learning methods.Meteor Mon, 45(3): 426-436
Received: 19 November 2021/ Accepted: 23 February 2022/ Published:25 April 2022
Jie Yan
yanjie@ncepu.edu.cn
Hongwei Yang
yanghw_e@163.com
Yongqian Liu
yqliu@ncepu.edu.cn
Zongpeng Song
songzongpeng@epri.sgcc.com.cn
2096-5117/© 2022 Global Energy Interconnection Development and Cooperation Organization.Production and hosting by Elsevier B.V.on behalf of KeAi Communications Co., Ltd.This is an open access article under the CC BY-NC-ND license (http: //creativecommons.org/licenses/by-nc-nd/4.0/ ).
Biographies

Hongwei Yang is currently studying at North China Electric Power University (NCEPU),studying for a master’s degree, and his research direction is numerical weather prediction based on artificial intelligence.

Jie Yan is the corresponding author, who received her joint educated Ph.D.degree in renewable & clean energy from North China Electric Power University (NCEPU), Beijing,China and University of Bath, Bath, U.K.in 2016.She is currently an associate professor with the school of renewable energy in NCEPU.Her major research interest includes wind/solar power forecasting, wind farm control and multi-energy operation.

Yongqian Liu received the Ph.D.degree in production automation from Nancy 1 University and the Ph.D.degree in hydropower engineering from the Huazhong University of Science and Technology in 2002.He has 30 years of professional experience on wind power and hydro power engineering.He is currently a Professor with the School of Renewable Energy, North China Electric Power University, Beijing,China.His main research interests focus on wind farm technologies,including wind resources assessment and wind farm design, wake modelling, wind power prediction, operation and maintenance of a wind farm.

Zongpeng Song received his Ph.D.degree at Institute of Atmospheric Physics, Chinese Academy of Science, Beijing, 2014.He is working in Renewable Energy Center, China Electric Power Research Institute, Beijing,China.
(Editor Dawei Wang)
