0 Introduction
Energy is the driving force for automation, modernization and economic development.Energy demand and greenhouse gas (GHG) emissions are key problems due to the fossil fuel-based energy supply.Over dependence on fossil fuels (i.e.petroleum oil, natural gas and coal)causes a negative impact on the environment [1, 2].The GHG emissions increase rapidly and the CO2 concentration reached 407.8 parts per million in 2018, from 405.5 parts per million in 2017 [3, 4].There is a close relationship between the earth’s temperature and atmospheric concentrations of the two major greenhouse gases (GHG): CO2 and CH4[5].In this case, CO2 has the highest radiative forcing contribution among longstanding GHGs [6].To reduce the mass consumption of fossil fuel and suppress the increase of CO2 concentration in the atmosphere, the share of renewable energy in total energy consumption needs to be augmented[7, 8].However, apart from implementing renewable energy plants, different countries have started introducing a CO2 tax with a view to pulling the reins of CO2 emission[9, 10].In recent years, the photocatalytic reduction of CO2 to methane (CH4) by using solar energy attracts the attention of researchers that can be a solution to both energy problems and environmental problems around the globe[11].Photocatalysis is an attractive technology that uses solar irradiation when it causes reactions.Photocatalysts are semiconductor materials that excite electrons when light with a certain energy level is projected on it.As a result,holes and electrons generated from the photocatalyst cause chemical reactions on the surface.Fujishima and Honda reported such electrochemical photolysis on the surface of TiO2 [12, 13].The basic photocatalytic reaction is shown in(1) [14].
The electron and the hole shown in (1) drive a reduction reaction and an oxidation reaction in succession.The reaction potential of some photocatalysts is high enough to reduce CO2 to organic compounds.Equations (2) -(4) show the formulas of photocatalytic CO2 reduction reaction [15].

The reduction of carbon dioxide into methane as in (2)and oxidation of water as in equation (3) occur as a reaction pair.On the other hand, equation (4) presents an ideal total reaction of the photocatalytic CO2 reduction reaction.Despite considerable research works being carried out on photocatalytic CO2 reduction; the reaction efficiency is still low.Besides, experimental conditions affect photocatalytic CO2 reduction [16-18].In practice, methane can be produced from CO2 reduction using solar energy which is a carbon-neutral process.Moreover, the methane produced by photocatalytic CO2 reduction can be stored for future use.Ola et al.reviewed structural designs of photocatalytic CO2 reduction as well as reactor designs [19].Reactor designs depend, to a good extent, on the states of the photocatalyst whether it is powder type or an immobilized type [19].Liu et al.[20] reported that photocatalytic CO2 reduction occurred under the gas phase with CO2 and steam by using three types of oxygen-deficient TiO2.Habisreutinger et al.[15] observed that the reduction of CO2 to methane occurs under a suspension condition.Kaneco et al.[17] related the photocatalytic CO2 reduction reaction with pressure inside the reactor.Abdel-Maksoud and Ramadan [21] presented a reactor design that utilizes TiO2 photocatalyst for water treatment.The authors concluded that a shallow vessel with immobilized TiO2 has potential for practical application in terms of mass transfer, continuous gas supply, and others.
Several mechanisms for photocatalytic CO2 reduction have been proposed based on the characteristics of materials and the effect of reaction conditions.Trudewind et al.[22] evaluated the environmental impacts of the photocatalytic methane production processes by using life cycle assessment (LCA).Herron et al.[23] studied photocatalytic methanol production processes in terms of energy and economics.Authors reported that the selectivity of products and one pass conversion rate have great impacts on energy consumption for whole processes and production costs.Pinaud et al.[24] reported the technical and economic feasibility of photocatalytic hydrogen production which applies similar processes to photocatalytic methane production.
The above literature review reveals that research works are underway to find the course for efficient photocatalytic methane production.The efficiency of solar energy usage also has a close relationship with photocatalytic material from the viewpoint of a bandgap.However, an extensive feasibility study for photocatalytic methane production is essential to lead the development of materials to be more efficient and effective.Though environmental and energy analysis of photocatalytic methane production is studied,economic analysis of photocatalytic methane production is not explored yet.Moreover, it is important to examine the future availability of emerging technologies that include the entire process on large scale.In this paper, an energy,environmental, and economic assessment of photocatalytic methane production is conducted taking account into the concept of CO2 tax.The processes considered include CO2 capture, solar reactor, and gas purification.
1 Methodology
Photocatalytic methane production comprises three main processes as shown in Fig.1.First, the CO2 capture process extracts only CO2 from the exhaust gas by utilizing chemical and physical properties [25].This process is compulsory because the concentrations of CO2 in the exhaust gas from thermal power plants are 8-25% and the gas includes various kinds of impurities [26].
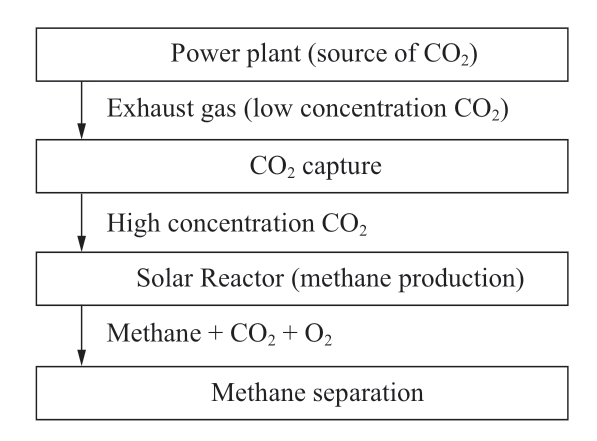
Fig.1 Process flow of photocatalytic CH4 production
Secondly, the photocatalyst reduces CO2 to methane by utilizing solar energy in a solar reactor.Lastly, purification or separation of methane gas from gases that are extracted from the solar reactor.In this way, CO2, which is supposed to be emitted into the atmosphere, is captured by utilizing energy from solar irradiation.The methane gas produced by processes is used in the natural gas power plant.The processes have been detailed in the subsequent sections.
1.1 CO2 capture process
In this process, CO2 is extracted from gas sources such as the exhaust gas of the thermal power plant.There are three important factors that define the properties of the CO2 capture process; the exhaust gas quality, the quality of output CO2,and the purification method.Dey et al.[27] report that the gas quality in the solar reactor affects the photocatalytic CO2 reduction reactions.The purity of CO2 is important to induce proper reactions and affects the overall reactions.
The quality of exhaust gas from the power plant depends on combustion types and fuels.It is reported that the CO2 concentrations in the flue gas are 14% from a coal-fired boiler, 8% from a natural gas-fired boiler, more than 80%from coal combustion with high concentration oxygen, and 40% from natural gas with partially oxidized air [25].The CO2 capture process may not be required in the case of coal combustion with a high concentration oxygen process.Alie et al.[28] simulate CO2 capture processes that use MEA scrubbing and it is found that the CO2 concentration affects the reboiler duty in the process.The result implies that the low concentration CO2 consumes more energy than the high concentration CO2 gas in the process.Therefore, the necessity of the CO2 capture process depends on the exhaust gas quality and the quality of exhaust gas affects the CO2 capture process.In this study, exhaust gas from a natural gas power plant is assumed as a supply source of CO2.
The CO2 reduction reaction requires a certain gas quality for the reaction to proceed efficiently.From the literature review, previous research did not examine the impact of impurities in source gas on the CO2 reduction reaction, as the research on the present state of CO2 reduction reaction did not reach a practical level.Therefore, the researchers only focus on how to increase CO2 to methane conversion rate from pure CO2 that does not include the gas impurities such as SOX, NOX, and others.Therefore, there is a possibility that the gas impurities cause unexpected reactions whereby the consequence might be severe and difficult to deal with.
There are four main technologies for CO2 capture from CO2 source gases; absorption process, adsorption process, cryogenic process, and membrane process [25].Each process has advantages and disadvantages.The absorption process is matured technology for capturing post-combustion gas.The monoethanolamine (MEA)based on absorption processes is becoming a competitive technology.Figure 2 shows a process diagram of MEA based CO2 capture.CO2 in scrubbed flue gas is absorbed by MEA in the first process.Then, CO2 in MEA is stripped by adding heat and a high concentration of CO2 is collected from MEA.Based on the necessary quality of output gas,MEA is selected for the CO2 capture process. Kim et al.[29] simulated CO2 capture processes that capture CO2 from the flue gas by MEA based absorption and calculated CO2 capture cost [29].The calculated cost is USD0.0396/kg-CO2.In this study, the CO2 capture cost is calculated based on USD0.0396/kg-CO2.
1.2 Solar reactor
A solar reactor is a closed system wherein the photocatalytic CO2 reduction reaction to methane occurs in the presence of sunlight.It consists of a reactor, a photocatalyst and a solution that aids the photocatalytic reaction.Solar reactor design and solution selection depend on the physical characteristics of the photocatalyst whether it is in powder form or thin film; the reaction conditions,viz., temperature, pressure, solution; and the selection of methane and methanol.
Generally, the cost of photocatalyst follows a previous study wherein TiO2 based photocatalyst is assumed [24].There are two types of reactors; the fluidized (suspended)bed type for powder photocatalyst and the fixed bed type for thin film.The selection of the reactor is the most important part because the cost of the reactor accounts for a large portion of the installation cost.
1.3 Separation of methane from mix gases
There are two options for usage of the produced gas,e.g., methane gas and natural gas.The necessity of methane purification depends on the one-pass conversion rate of the process in the solar reactor and the way the produced gas is used for.If the concentration of methane gas in the mixed gasses is high enough, gases from the solar reactor can be used directly as the combustion gas at a natural gas power plant.In addition, the mixed gas containing oxygen can help the combustion efficiency because mixed gases contain oxygen as well as methane gas.If the one-pass conversion rate is low, the CO2 in the mixed gas needs to be removed.In this study, the CO2 is extracted from mixed gas by using the CO2 capture process.
Alie et al.[28] reported the reboiler duty for MEA process changed by input CO2 concentration.Therefore, the cost of the CO2 extraction process from produced gases is expected 70% of the CO2 capture process because the CO2 concentration in the output gas from the solar reactor is 25%.
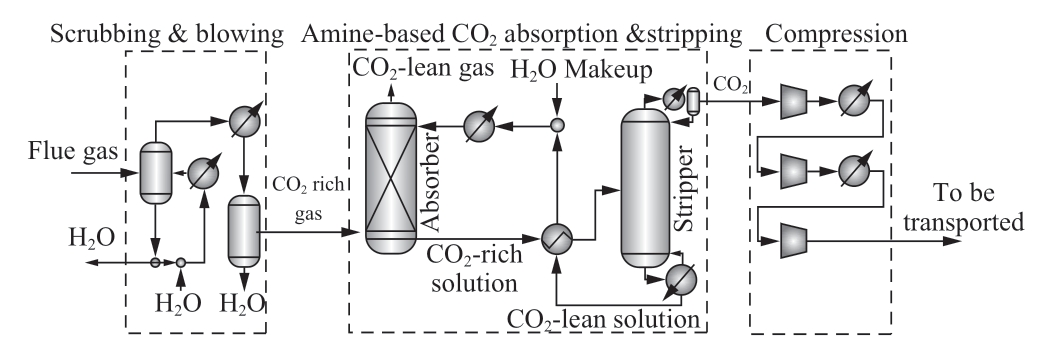
Fig.2 Process diagram of MEA based CO2 capture [29]
1.4 Plant cost assumption
In this study, a fluidized type reactor is supposed to be employed and the cost is assumed based on the data in the previous research [24].The installation cost, labour cost,and land cost are assumed based on each country’s situation of Japan and Malaysia, which are summarized in Table 1.The area of the solar irradiation capture is 72,000 m2.The total plant area is 90,000 m2 which includes the area for CO2 capture devices, methane purification devices and control systems for solar reactors.
Table 1 Reactor cost information [24]
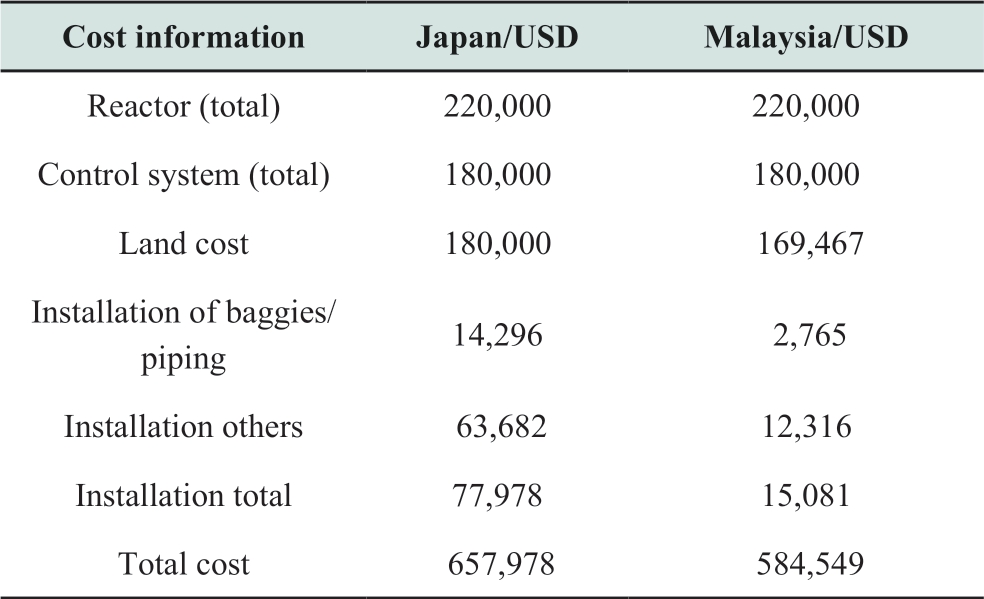
Figure 3 shows the schematic diagram of the solar reactor.The solar reactor catches solar irradiation on the upper surface.Inside the solar reactor is a suspension and gas-phase that consists of CO2 and other produced gases.A lifetime of five years is considered for the solar reactors and photocatalysts, that is, renovation works would be necessary after every five years (years 6, 11, 16 and so on).The period of renovation is set at four months and methane production in the renovation year is curtailed to two-thirds of the normal running years.Renovation cost includes reactor cost,photocatalyst cost, and installation of reactors and piping cost.The installation cost is calculated based on the average labour cost in Japan and Malaysia.Average annual wage costs in Japan and Malaysia are USD39,113 and USD7,560 respectively in 2016 [30, 31].The land cost is assumed at USD2/m2 and USD1.88/m2 (MYR 30,000/acre) respectively in Japan and Malaysia [32, 33].
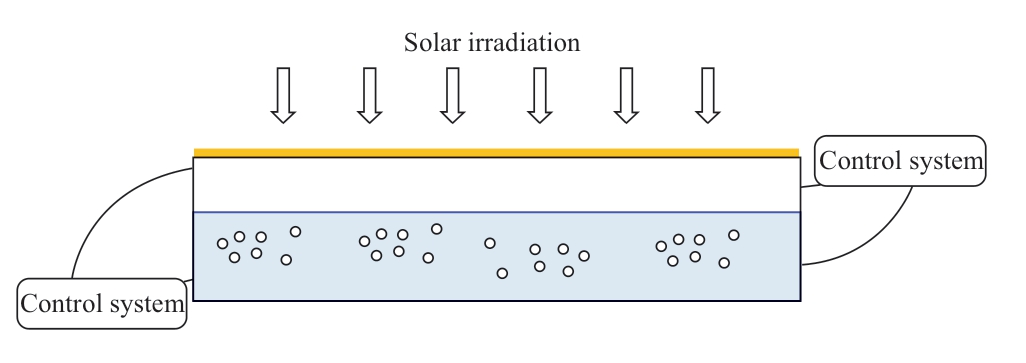
Fig.3 Schematic diagram of the solar reactor for suspension type
1.4.1 Conversion efficiency
Photocatalytic ability and quantum efficiency are used to portray the conversion efficiency of the reactor.Photocatalytic ability, as given by (5), represents the yield that one gram of photocatalyst produces in one hour.However, this method does not consider input light irradiation energy.On the other hand, equation (6) shows the formula of quantum efficiency [34], which is the ratio of photons that are used for reactions to photons that are absorbed by a photocatalyst.

However, in this study.the ratio of Gibbs energy of product to input irradiation energy has been adopted as the conversion efficiency as in (7) [34].The standard of this rate does not depend on the photocatalyst’s bandgap and range of absorbance.Therefore, conversion efficiency evaluates the energy utilization efficiency that does not depend on material characteristics.
There are other important conversion rates such as laboratory-scale maximum conversion rate, largescale efficiency, and feasible conversion rate.Normally,laboratory-scale efficiency is higher than large-scale efficiency because of the difficulties in condition control.Feasible conversion efficiency is the efficiency that satisfies the energy and economic as well as environmental requirement in practical use.In this study, 3%, 4%, 5%,6%, 7%, 8%, 9% and 10% of conversion efficiencies are assumed.
1.4.2 One pass conversion rate of CO2
One pass conversion rate in this study indicates the ratio of conversion from CO2 to methane [23].For efficient use of CO2, it is important to extract the CO2 that is not reduced to methane from mixed gases and reuse it in the solar reactor again.Therefore, the higher the one-pass conversion rate the lower the additional CO2 extraction cost.Because the cost of CO2 capture increases when one pass conversion rate is low.One pass conversion rate of 100% indicates that all of the CO2 in the reactor is reduced to methane.In fact,CO2 cannot be converted to methane 100% because of the time, efficiency, and cost constraints.One pass conversion rate affects the cost of CO2 removal from the mixed gas produced in the solar reactor [35].In this study, one pass conversion rate is expected at 50%.This means 50% of CO2 in the reactor is reduced to methane and 50% of CO2 remains as CO2 when it is extracted from the solar reactors.
1.4.3 Intensity of solar irradiation
The intensity of solar irradiation is an important indicator for photocatalytic methane production.This intensity changes by different areas and climates the place belongs.Table 2 shows solar irradiation intensity in each city [36, 37].In this study, global solar radiation in the capital city is used for solar energy in each country.Malaysia has higher solar radiation intensity which helps to make the photocatalytic methane production plant small because the total energy that the plant receives from the sun is calculated based on the area of the plant and the intensity of solar radiation.
Table 2 Solar irradiation intensity [36, 37]

1.5 Energy assessment
The amount of methane production is calculated to study the energy production potential, which is given by (8).
where SE: solar irradiation energy, CE: conversion efficiency, Area: solar irradiation capture area, ECO2 capture:energy consumed CO2 capture process.
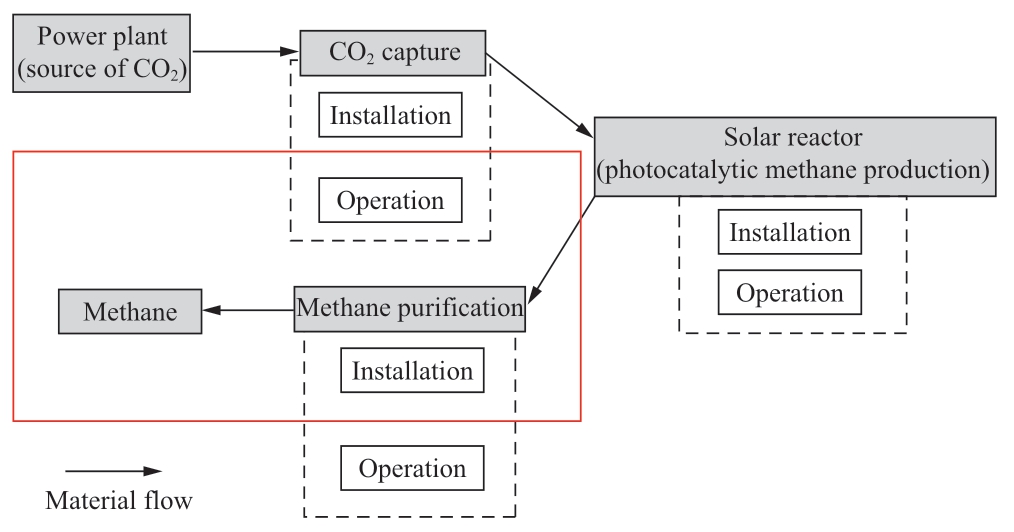
Fig.4 Energy assessment protocol for photocatalytic CH4 production (transportation between processes is not included)
A photocatalytic methane production plant consists of energy-consuming processes such as fuels for the CO2 capture process, control systems for the CO2 capture process and reactors, etc.The CO2 capture process and methane separation process consumes certain energy to extract CO2 from MEA solution.Mondal et al.[25] reviewed that the energy requirement for each kilogram (kg) of the CO2 capture process is 4-6 MJ, 2-3 MJ, 0.5-6 MJ, and 6-10 MJ for the absorption process, adsorption process,membrane process, and cryogenic process respectively.In this study, energy consumption for each kilogram (kg) of CO2 capture and methane separation has been considered as 0 MJ, 0.5 MJ, 3 MJ, 6 MJ/kg.Figure 4 is shown the energy assessment protocol which includes the following energy consumption and production: operation of the CO2 capture process, operation of the methane purification process, and methane product.
1.6 Environmental impact assessment
In this study, the amount of CO2 emission reduction by the photocatalytic methane production plant in the case of Japan and Malaysia has been calculated to analyse the environmental impact of the plant.Reduction in CO2 emission is calculated based on methane production amount by using (9).
where MCO2: molar weight of CO2, MCH4: molar weight of methane.
Figure 5 presents the sequences in environmental assessment which includes methane product.It is to be noted here that CO2 emission from other processes is not calculated.
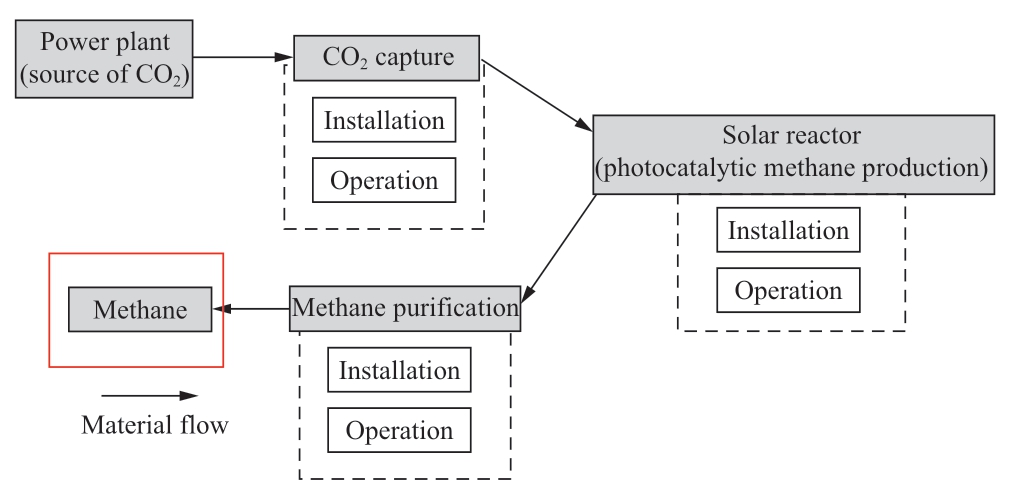
Fig.5 Environmental assessment protocol for photocatalytic CH 4 production (transportation between processes is not included)
1.7 Economic assessment
Economic assessment includes methane selling income,operation and installation cost of CO2 capture process and methane purification process and solar reactor.The assessment also includes the exemption of CO2 tax by using CO2 for methane production.The economic assessment protocol has been illustrated in Fig.6.The indicators used for economic analysis are basically net present value (NPV)and payback period (PBP).In addition, the CO2 tax and natural gas price are also considered.
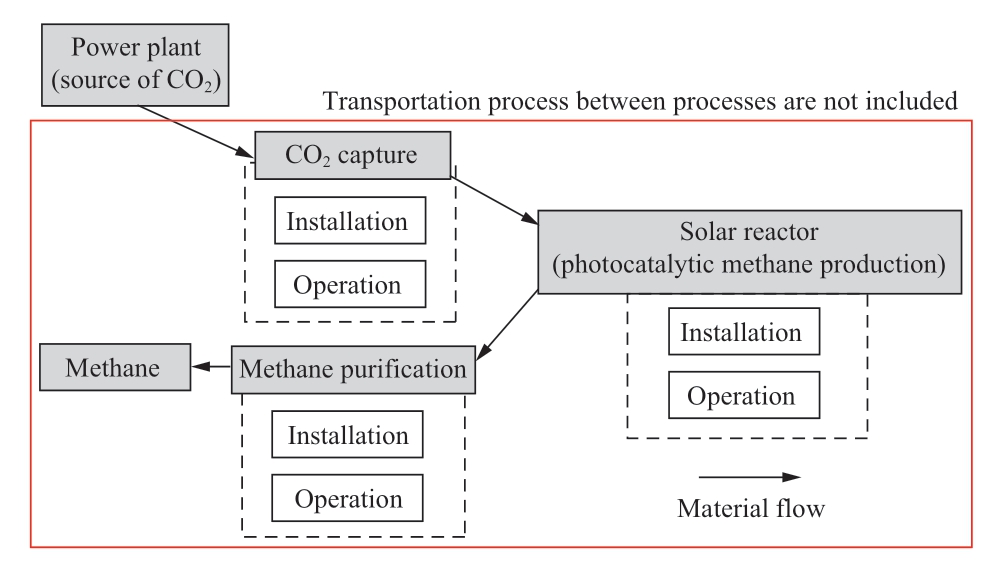
Fig.6 Economic assessment protocol for photocatalytic CH 4 production (transportation between processes is not included)
1.7.1 Net present value
Net present value (NPV) is an indicator of economic feasibility evaluation.Equation (10) shows a formula for NPV, which is the sum of values that are converted into zero-year values by using a specific rate (r) [38, 39].In this study, a discount rate of 5% has been considered for both countries.

where S: Primary installation cost, CFi: annual revenue, r:discount rate, i: year.Annual revenue (CF) is calculated by(11) as

where MP: methane production cost, MSP: methane selling price, Gas processing cost: cost of CO2 capture cost and methane purification cost, O&M: operation and maintenance cost (5% of installation cost excluding land cost), Renovation cost: will be applied only in year 6, 11, 16.
1.7.2 Payback period
The payback period is the years that investors collect the total investment.The discounted payback period (DPP)has been calculated by using the time value of money when the project cash inflows reach a period and the net cash flows are equal to the initial cost of the project.DPP can be calculated by using (12) [40, 41].
where, CFn is the cash flow related to the n-th year and r is the discount rate.
1.7.3 CO2 tax
The different scenarios that have been considered in this study is based on CO2 tax.Several values of CO2 tax are considered based on the already introduced CO2 tax values.Then, the effect of the CO2 tax value on economic indicators is studied.In the plant, CO2 is consumed by photocatalytic methane production as a raw material of methane.The CO2 tax is not collected for the CO2 used for methane production.Therefore, the reduction value can be considered a benefit to the plant.Table 3 shows the list of CO2 taxes and countries[9, 10, 42].The range of tax rates is around USD2-170 based on each country’s situation.
Table 3 List of CO2 tax and countries in the year 2021 [42, 43]
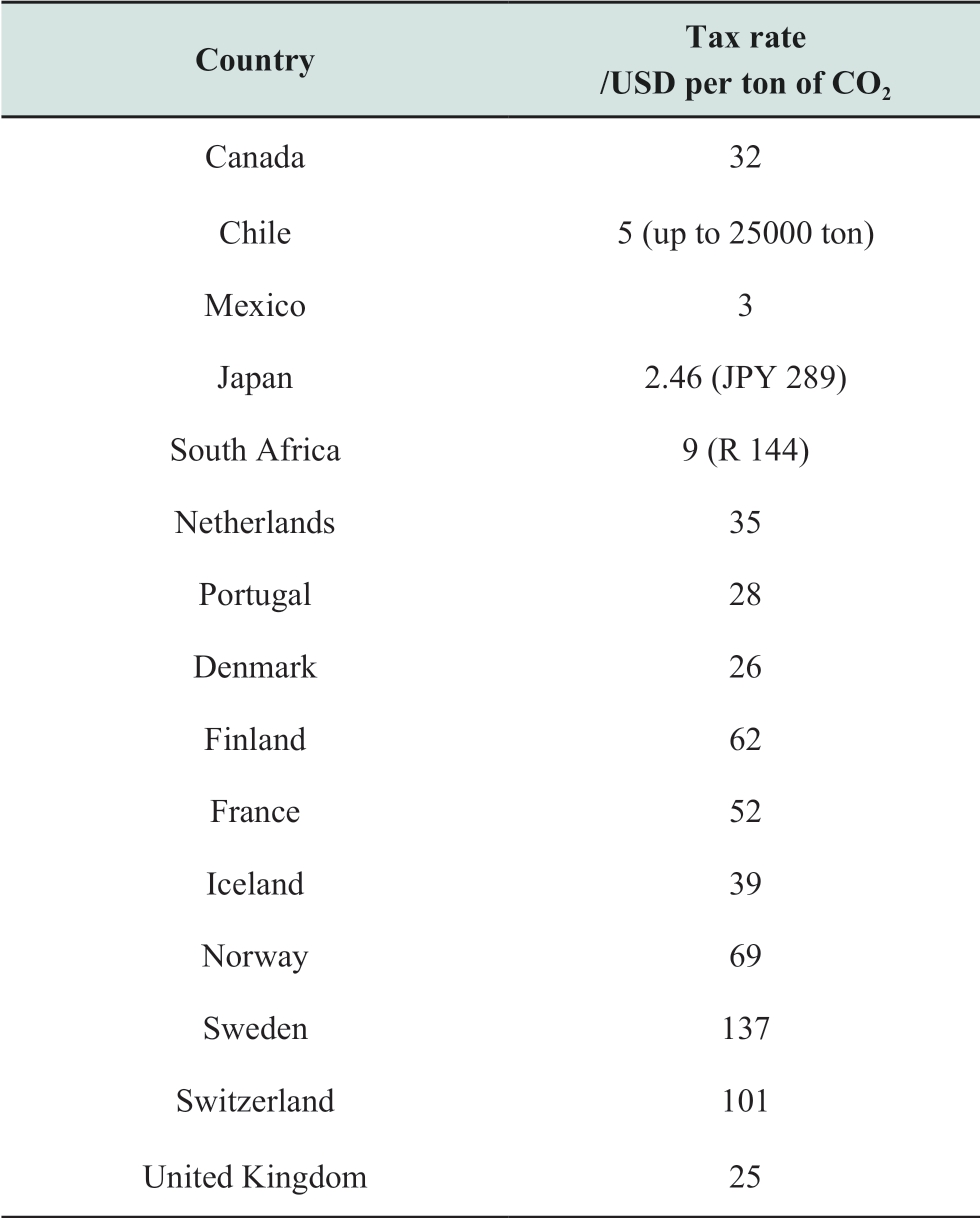
In this study, the following tax prices are expected: no tax, USD2.63, USD10, and USD20 per ton of CO2.At its current status, Malaysia does not implement the CO2 tax and Japan implements USD2.63/ton of CO2.In addition to current prices, the scenarios of USD10 and USD20/ton of CO2 is calculated.
1.7.4 Natural gas price
Energy prices depend on the circumstances of each country.In the case of Japan, the natural gas price is higher than in other countries because Japan imports almost all the natural gas from Australia, Southeast Asia, Middle East,Russia, and others.After the Great East Japan Earthquake in 2011, Japan’s LNG rose to around USD18.00; however,by 2017 the price is settled at around USD8.00 [44].On the other hand, Malaysia’s gas price for the power sector is rising every six months since July 2015.The gas price for the power sector in Malaysia was USD6.19 (MYR 24.20) in January and February 2018 (based on the exchange rate of USD1.00 = MYR 3.90949 on 16.03.2018) [45].Therefore,the average price in 2017 is selected as Japan’s natural gas price and the current (2018) gas price is selected as Malaysia’s gas price.
2 Results and Discussion
2.1 Energy assessment
Energy balance of the photocatalytic methane production plant is evaluated by the amount of methane produced by the plant.Figuer 7 shows the relation between methane production and conversion efficiency.Methane production is calculated from solar energy and conversion efficiency.Therefore, Malaysia has a higher energy production capacity than Japan even when the conversion efficiency is the same.At 10% conversion efficiency, the photocatalytic methane production plant produces 860 TJ methane in Malaysia in 20 years whereas this figure (699 TJ) is almost 20% less in Japan.
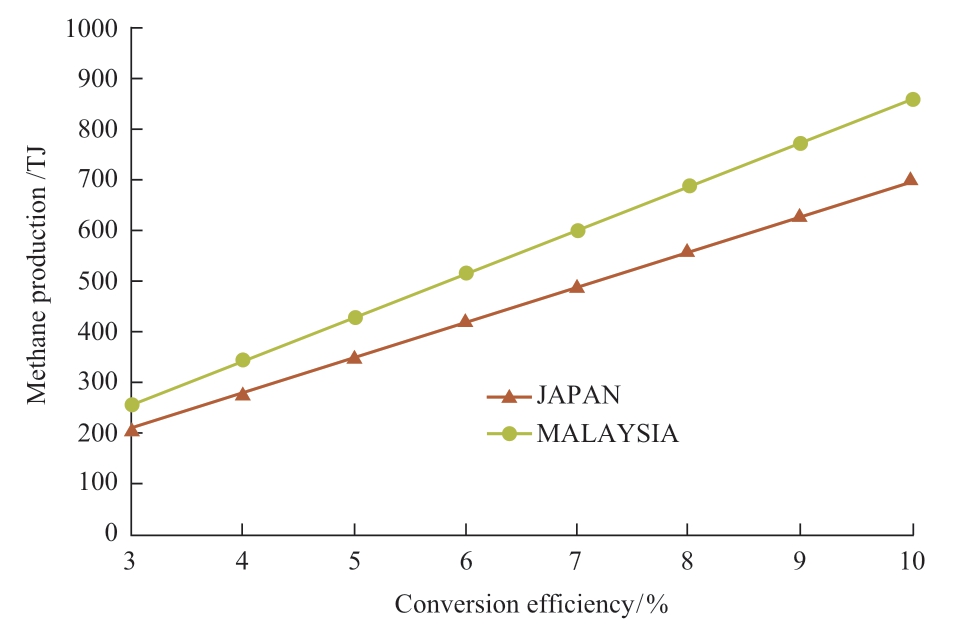
Fig.7 Relation between methane production and conversion efficiency
Apart from the direct effect, the indirect effect of methane and oxygen mixed gas should also be considered.Scheffknecht et al.[46] mentioned that oxyfuel improves power generation efficiency.According to this finding,improved efficiency power generation by methane and oxygen mixed gas managed to reduce fuel consumption per unit.This fuel consumption reduction can be considered the additional benefit of the products from the photocatalytic methane production plant.
Figure 8 shows the relation between the energy used for the CO2 capture process and produced energy from the photocatalytic methane production process.The energy production is based on the heat of combustion of methane which is 890.36 kJ/mol [47, 48].For this calculation, the one-pass conversion rate is taken as 50%.5.5 kg of captured CO2 is used for 1.0 kg of methane production and 2.75 kg of captured CO2 remains in the output gas.As shown in Fig.8, when 6 MJ/t of CO2 of energy is used for the CO2 capture process, which is the current energy consumption for the CO2 capture process, the net produced energy value becomes only 49.6% of the produced methane.Therefore,the reduction of energy consumption for the CO2 capture process will make energy production more efficient.
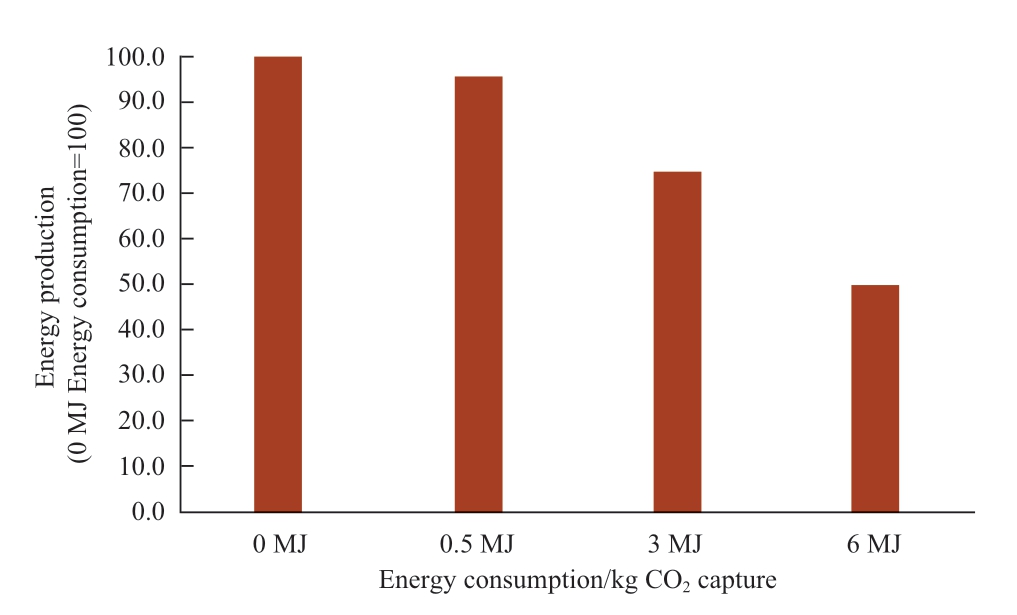
Fig.8 Effect of the energy consumed by the CO2 capture process for methane production
2.2 Environmental impact assessment
Environmental impact is evaluated based on the amount of CO2 emission reduction, that is, the amount of CO2 converted to methane by the photocatalytic methane production plant.The main factor which determines the CO2 emission reduction is conversion efficiency and solar irradiation energy.Figure 9 shows that at 10% efficiency,the amount of CO2 emission reduction in Malaysia is 42,504 t of CO2 whereas in Japan this figure is 34,550 t of CO2.Therefore, CO2 emission reduction in Malaysia is almost 23% higher than that in Japan.This is because Malaysia is a sun-drenched country and has abundant solar irradiation energy that helps to improve its emission reduction potential.Another interesting fact is that the above amount of CO2 emission reduction represents 0.00303% of total CO2 emission in Japan [49], while in Malaysia it is 0.0193%[50].It may be noted here that the amount of CO2 used for methane production matches the amount of CO2 emission from the 0.6 MW natural gas power plant for 20 years.The plant scale considered in the present study is 0.09 km2;scaling up the plant will make a larger impact.
In addition to the direct CO2 emission reduction, the indirect CO2 reduction emission from a power plant should also be considered.However, it is not considered in this study because of its uncertainty.The output gas from the CO2 reduction plant is a mixed gas of methane and oxygen whereby the portion is suitable for combustion and is considered oxyfuel.Scheffknecht et al.[46] mentioned that oxyfuel has the potential to reduce CO2 emission in electric power generation.Therefore, the use of methane and oxygen mixed gas for electricity generation will have the potential to reduce the CO2 emission from the power plant.
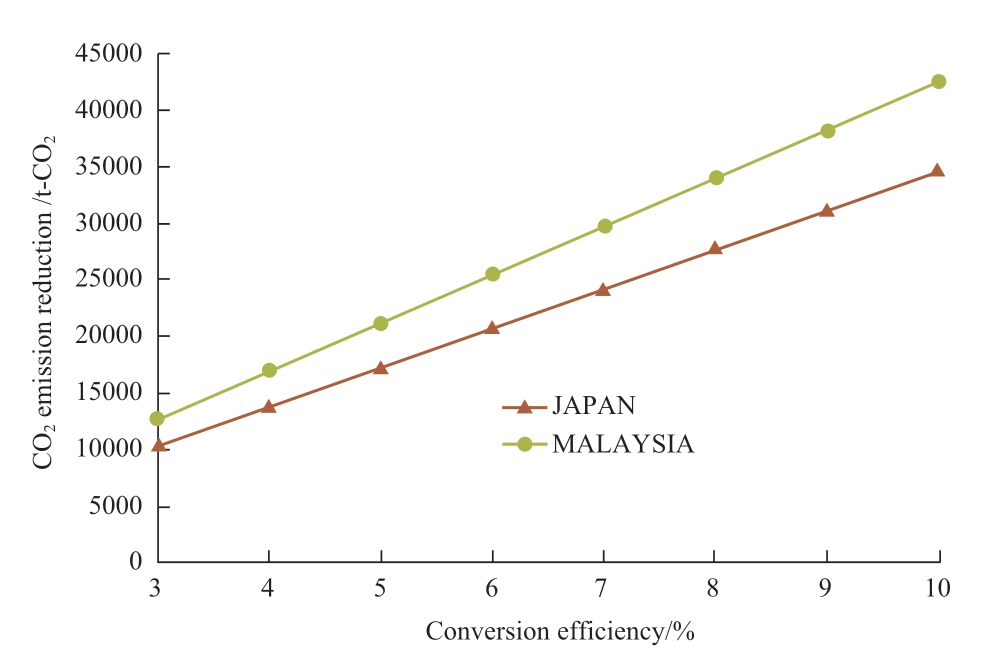
Fig.9 The relation between CO2 emission reduction and conversion efficiency
2.3 Economic assessment
Regarding Japan’s current natural gas price and solar irradiation data, the relations between NPV and conversion efficiency and payback period are shown in Fig.10 and Fig.11 respectively, where the variables are the CO2 tax prices with their respective conversion efficiencies.For all the cases, the natural gas price is taken as USD8.02 per MMBtu,which is Japan’s current price.When the conversion efficiency is more than 7.10%, NPV shows positive values representing economic feasibility.Conversion efficiencies where the NPV equals zero are 7.10% (CO2 tax USD2.63/t of CO2), 6.55% (CO2 tax USD10/t of CO2), 5.93% (CO2 tax USD20/t of CO2).The increase of USD10 CO2 tax is worth approximately 0.5% of efficiency.From Fig.10, when the CO2 tax is USD2.63, the payback periods for conversion efficiencies of 3% to 5% are more than 20 years.When CO2 tax prices are USD10/t of CO2 and USD20/t of CO2,the payback period for conversion efficiencies of 3% to 5% is more than 20 years.From the results in Fig.10 and Fig.11, around 8% of conversion efficiency is found to be the feasible conversion efficiency for the photocatalytic methane production plant in Japan.
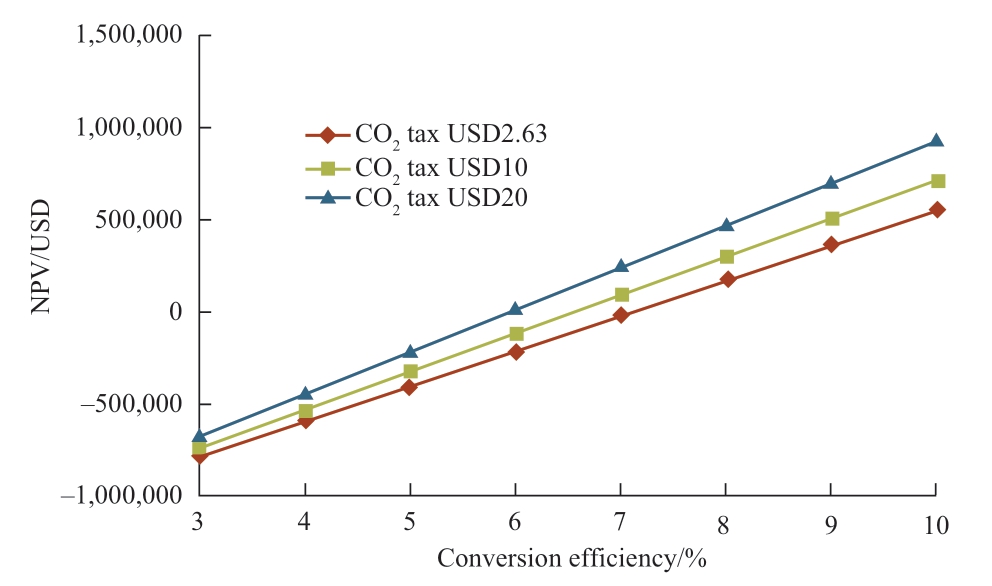
Fig.10 Relation between NPV and conversion efficiency(Japan) Conversion efficiency/%
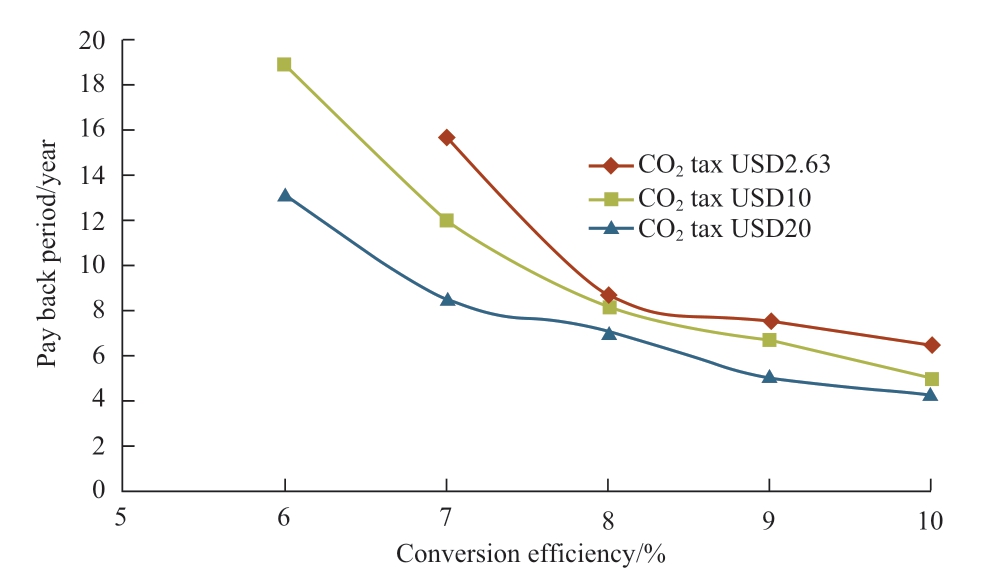
Fig.11 Relation between payback period and conversion efficiency (Japan) Conversion efficiency/%
Regarding Japan’s current CO2 tax and solar irradiation data, the relations between NPV and conversion efficiency and payback period are shown in Fig.12 and Fig.13 respectively, wherein variables considered are the natural gas prices with their respective conversion efficiencies.For all cases, Japan’s current CO2 tax is considered, which is USD2.63/t of CO2.Referring to Fig.12, when the natural gas price is USD4 and USD6/MMBtu, the NPV shows negative values for conversion efficiency of less than 10%.In this case, the payback periods are improper values that are more than 20 years as shown in Fig.13.On the other hand, when the natural gas price is similar to the current natural gas price in Japan, which is USD 8.02/MMBtu, the feasible conversion efficiency is achieved which is around 8% as seen in Fig.12 and payback is 9.2 years as seen in Fig.13.From the calculation result shown in Fig.12,conversion efficiencies that make NPV to be zero value are 53.0% (NG USD4/MMBtu), 12.5% (NG USD6/ MMBtu),7.10% (NG USD8.02/MMBtu), 4.97% (NG USD10/MMBtu), 3.82% (NG USD12/MMBtu).From this result,the higher the natural gas price is the lower the feasible conversion efficiency is.Therefore, if the natural gas price rises, the feasibility of photocatalytic methane production gets better.
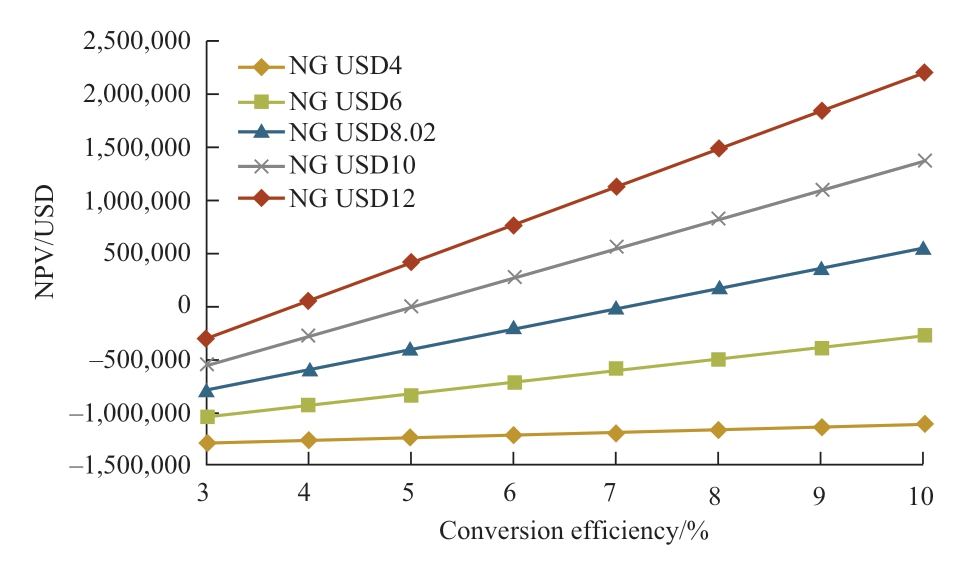
Fig.12 Relation between NPV and conversion efficiency(Japan)
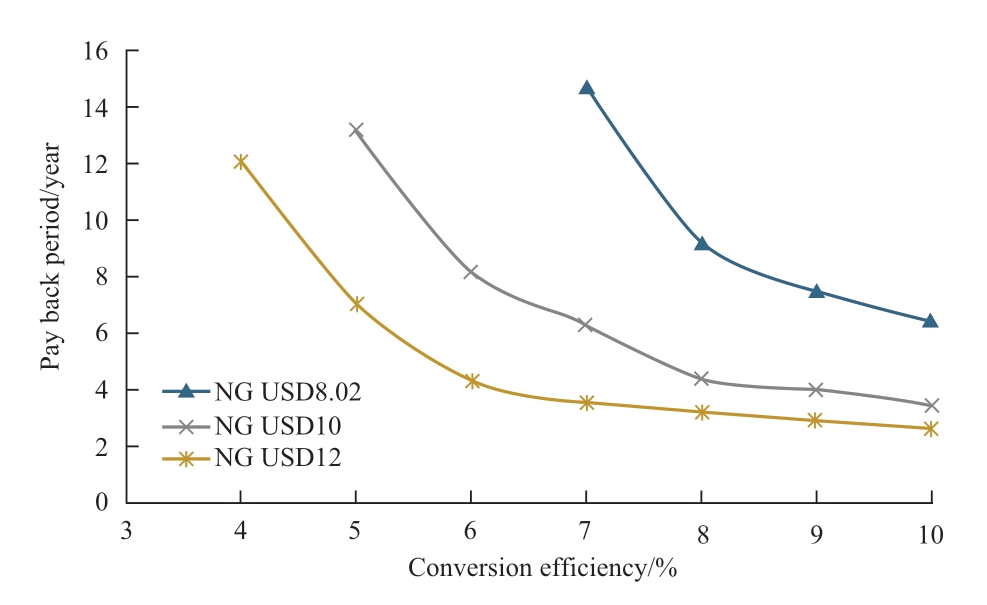
Fig.13 Relation between payback period and conversion efficiency (Japan)
Regarding Malaysia’s current natural gas price and solar irradiation data, the relations between NPV and conversion efficiency and payback period are shown in Fig.14 and Fig.15 respectively, wherein variables considered are the CO2 tax prices with their respective conversion efficiencies.For all the cases, Malaysia’s current natural gas price is considered, which is USD6.19/MMBtu.Conversion efficiencies that make NPV be zero in Fig.14 are 8.24%(CO2 tax USD0), 6.90% (CO2 tax USD10/t of CO2), and 5.93% (CO2 tax USD20/t of CO2).Therefore, 8.24%conversion efficiency is the feasible conversion efficiency in terms of the current situation in Malaysia.From Fig.15,the conversion efficiency of around 8% can be the feasible conversion efficiency for the payback period except the CO2 tax is USD0 (zero).
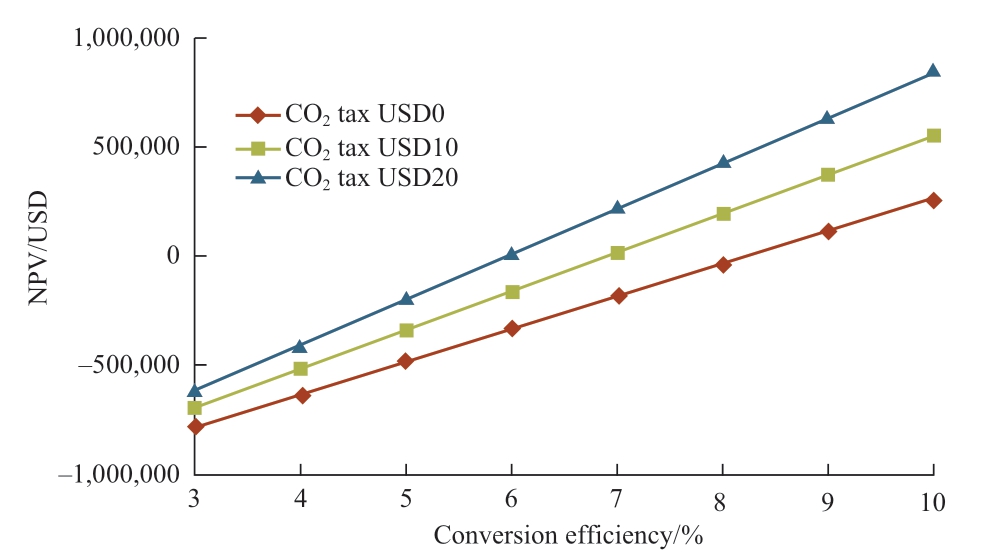
Fig.14 Relation between NPV and conversion efficiency(Malaysia)
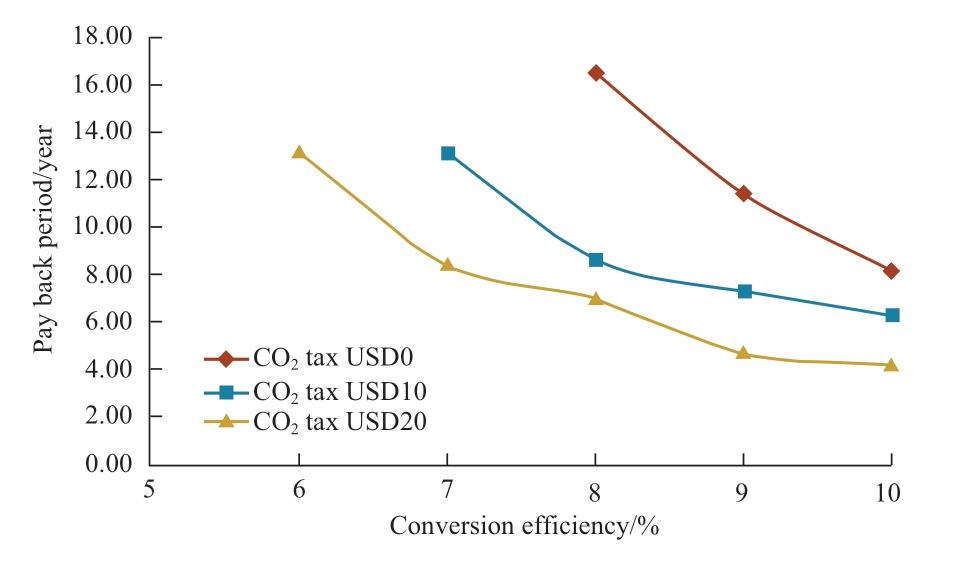
Fig.15 Relation between payback period and conversion efficiency (Malaysia)
Regarding Malaysia’s current CO2 tax price and solar irradiation, the relations between NPV and conversion efficiency and payback period are obtained as shown in Fig.16 and Fig.17 respectively, where variables are the natural gas prices with their respective conversion efficiencies.Since there was no CO2 tax in Malaysia up to 2020 CO2 tax is taken USD0/t of CO2 for all the cases in this study.Referring to Fig.16, when the natural gas price is USD4.0/MMBtu, NPV shows negative values for conversion efficiency of less than 10%.In this case, the payback period is improper values that are more than 20 years as shown in Fig.17.On the other hand, considering the current natural gas price in Malaysia, which is USD6.19/MMBtu, the feasible conversion efficiency is achieved is 8.24% as seen in Fig.16 and payback is 12.92 years at the conversion efficiency of 8.24% as seen in Fig.17.From Fig.16, conversion efficiencies that make NPV equal to be zero are 45.5% (NG USD4/MMBtu), 8.24% (NG USD6.19/MMBtu), 4.90% (NG USD8/MMBtu), 3.40%(NG USD10/ MMBtu), 2.60% (NG USD12/MMBtu).Therefore, if the natural gas price rises from the current price (USD6.19/MMBtu), the feasibility of photocatalytic methane production gets better significantly and the feasible conversion efficiency changes to less than half.
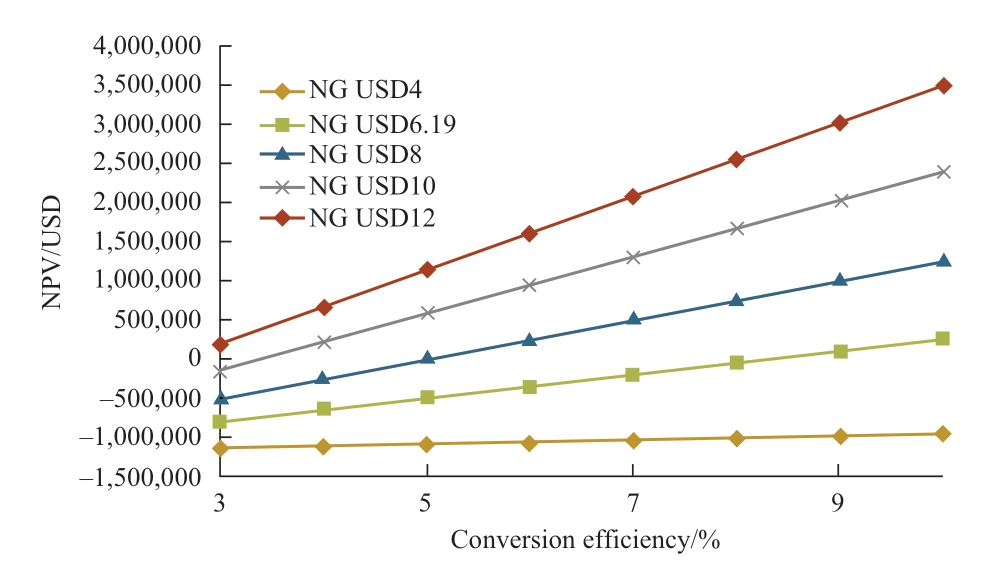
Fig.16 Relation between NPV and conversion efficiency(Malaysia)
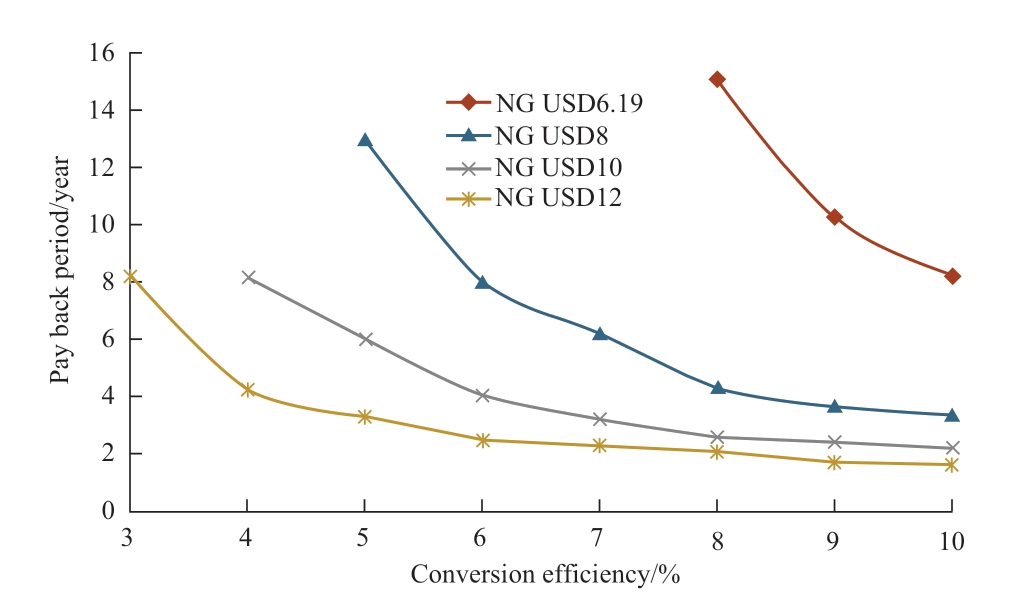
Fig.17 Relation between payback period and conversion efficiency (Malaysia)
The feasible conversion efficiency for Japan and Malaysia obtained are around 8%.Though Malaysia has higher solar irradiation, the feasible conversion efficiency in Malaysia is slightly higher than the feasible conversion efficiency in Japan, which because of the current energy price and CO2 tax.For the implementation of the photocatalytic methane production plant, the high energy price and CO2 tax will work as a driving force.From the viewpoint of the feasible conversion efficiency and economic situation, Japan has a higher potential for the installation of the photocatalytic methane production plant.
It is necessary for a photocatalyst to reach the feasible conversion efficiency that a photocatalyst utilizes more than 7.10% of solar irradiation energy because a photocatalyst can utilize only a certain amount of irradiation energy of irradiation that has a certain energy or above.Therefore, the conversion efficiency of 8% requires a quantum efficiency that is higher than 8%.From the solar spectrum data, it is necessary to utilize all the irradiation energy whose wavelength is less than 403 nm.If the energy efficiency in a certain wavelength range is 50%, a photocatalyst has to utilize the irradiation energy whose wavelength is less than 474 nm as shown in Fig.18 [51].
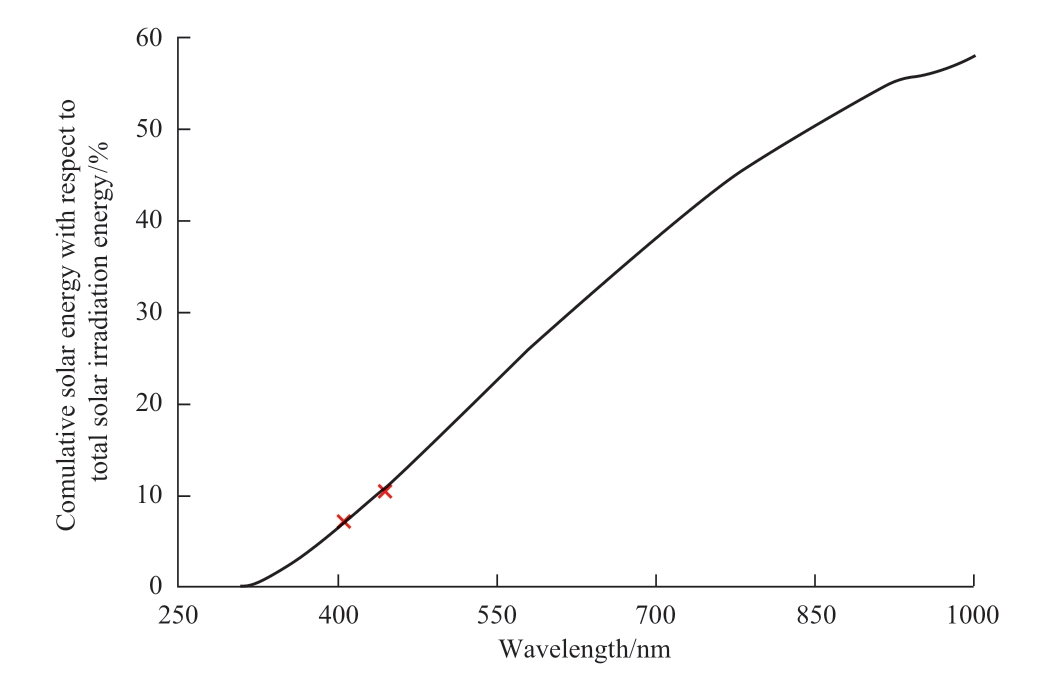
Fig.18 The relation between solar irradiation and the energy distribution of solar energy [51, 52]
2.4 Cost analysis
Based on Japan’s feasible case which is a conversion efficiency of 8% with a selling cost of USD8.02/MMBtu and the CO2 tax, the cost analysis is conducted.
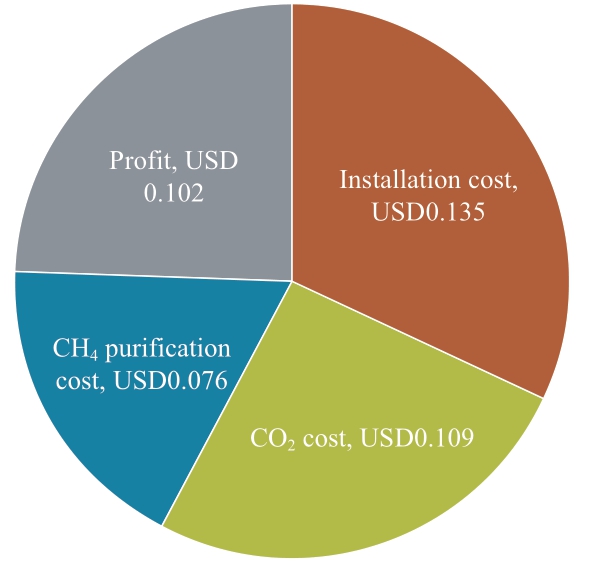
Fig.19 Breakdown of each factor for methane production and profit
The data used for this analysis are USD1,360,866 of installation cost including renovation cost, USD0.0396/kg of CO2 for purification cost, and 50% of one pass conversion rate.Figure 19 shows the breakdown of methane production cost and profit based on Japan’s natural gas price.The total value of installation cost per one kg of methane production,CO2 capture cost, methane purification cost and profit match the selling price of methane that is USD0.42/kg of CH4.Each process cost is USD0.135 for the installation cost,USD0.109 for the CO2 capture cost, and USD0.076 for the methane purification cost.
2.5 Sensitivity analysis
In this section, the sensitivities of each cost with respect to total cost are calculated.The sensitivities of installation cost, conversion efficiency, CO2 capture cost and methane purification cost are discussed.CO2 capture and methane purification processes are considered the same process because both processes are capturing CO2 from the exhaust gas and mix gas by absorber liquid (MEA).
Figure 20 shows the sensitivity analysis of conversion efficiency.The conversion efficiency directly affects the installation cost per one kg of methane production.This is because the amount of methane production is proportional to the conversion efficiency.Therefore, the conversion efficiency and the installation cost per one kg of methane become inversely proportional relation.In the case of 5%conversion efficiency, the total production cost is USD0.401 which is less than USD0.42 (1.0 kg natural gas price), the reaction rate is not feasible from an NPV viewpoint.This contradiction derives from a calculation method of NPV.For the total cost, the conversion efficiency of around 5%can be the feasible cost given that ignores project risks and discount rates.
From Fig.20, it is apparent that very low conversion efficiencies result in high production costs, while costs remain almost the same for conversion efficiency values of 10 or 15%.Moreover, the feasible conversion efficiencies obtained from the economic analysis are around 8 for Japan and Malaysia.Considering all these factors we have chosen 8% conversion efficiency for other sensitivity analyses.However, the CO2 tax is not considered in this analysis since the tax contributes to the revenue.
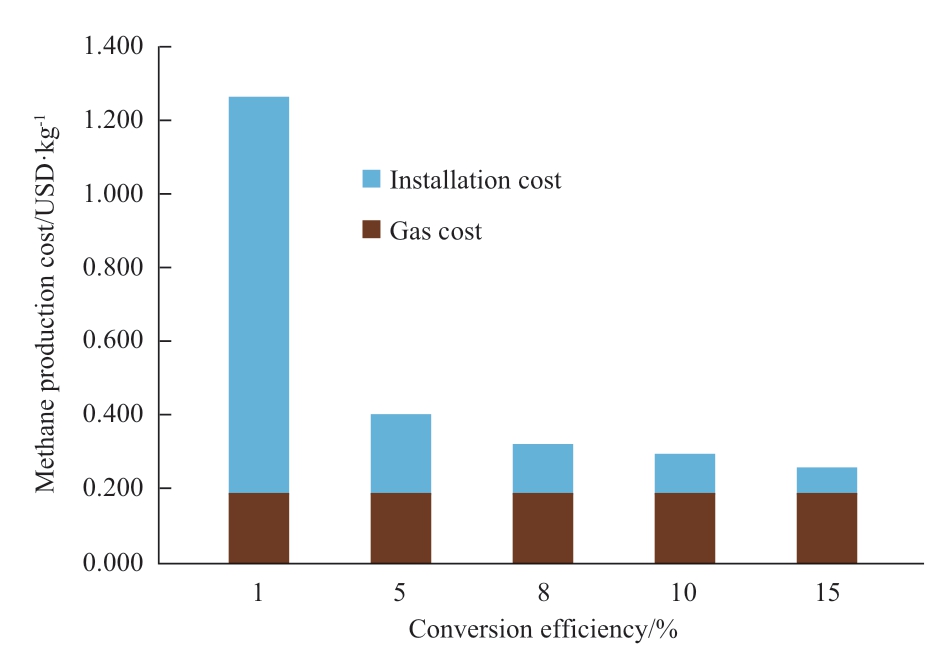
Fig.20 Cost sensitivity of conversion efficiency
Figure 21 shows a chart of cost sensitivity of installation cost versus methane production cost.The values are calculated by the amount of methane production and total installation cost that includes renovation costs.When the installation cost becomes one-tenth of the estimated price,the feasibility efficiency will be better.
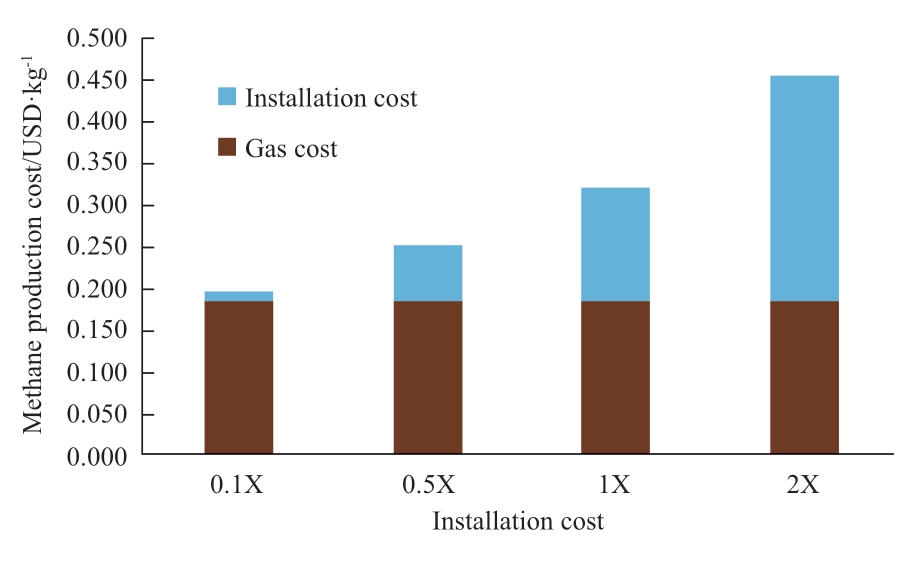
Fig.21 Cost sensitivity of installation cost
Figure 22 shows the sensitivity analysis of gas processing costs.The gas processing cost includes both the CO2 capture process and the methane purification process.The gas processing cost in the Figure indicates the 1.0 kg of CO2 capture cost.To produce 1.0 kg of methane gas, 2.75 kg of CO2 is required because the molar mass is different(CO2: 44g/mol, methane: 16g/mol).For this analysis,one pass conversion rate also has an impact on the gas processing cost.The lower the one-pass conversion rate is,the higher the amount of CO2 is collected from the methane purification process.This indicates the low one pass conversion rate increases methane purification costs.
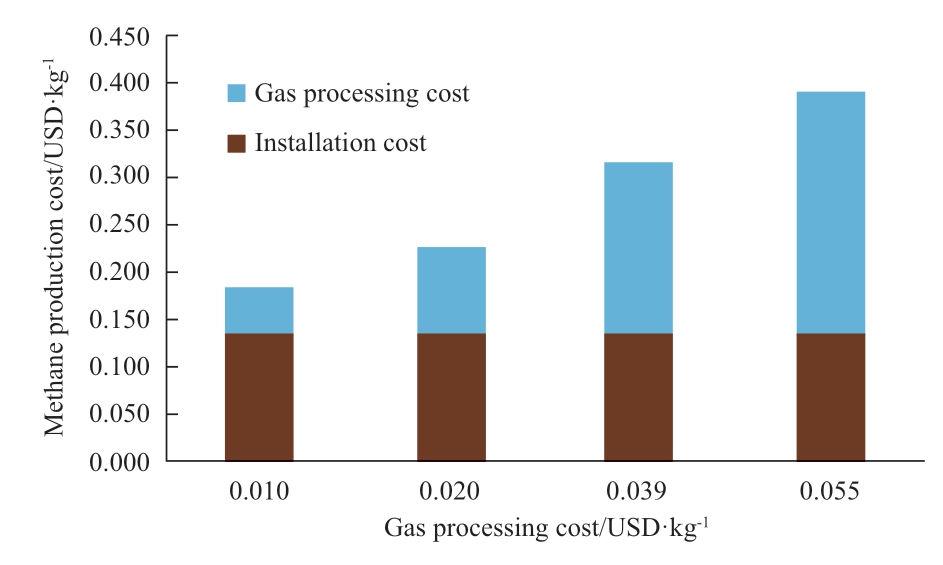
Fig.22 Cost sensitivity of CO2 purification cost
3 Conclusion
The photocatalytic methane production plant is analysed from the viewpoints of energy, environment, and economy.From the energy assessment and environmental assessments,Malaysia has a higher potential for photocatalytic methane production plants compared to Japan due to higher solar intensity.In the case where the conversion efficiency is 10%, the photocatalytic methane production plant produces 860 TJ and 699 TJ for Malaysia and Japan respectively in 20 years, which amounts are equivalent to the reduction of 42,504 t of CO2 and 34,550 t of CO2 for Malaysia and Japan respectively.In addition, the produced gases that consist of methane and oxygen from the plant have the potential to improve power generation efficiency.
From the economic analysis, feasible conversion efficiencies were 8% for Japan and Malaysia.To achieve 8% of conversion efficiency, the photocatalyst must utilize all the solar irradiation energy whose wavelength is smaller than 403 nm.Therefore, for the practical photocatalyst design, photocatalyst for CO2 reduction need to utilize solar energy whose wavelength is smaller than 474 nm in case of 50% of quantum efficiency.
From the sensitivity analysis, the energy for the CO2 capture process, installation cost, conversion efficiency, and gas processing cost have large impacts on the feasibility of photocatalytic methane production.Therefore, further technology development related to the processes is necessary for the implementation of photocatalytic methane production.
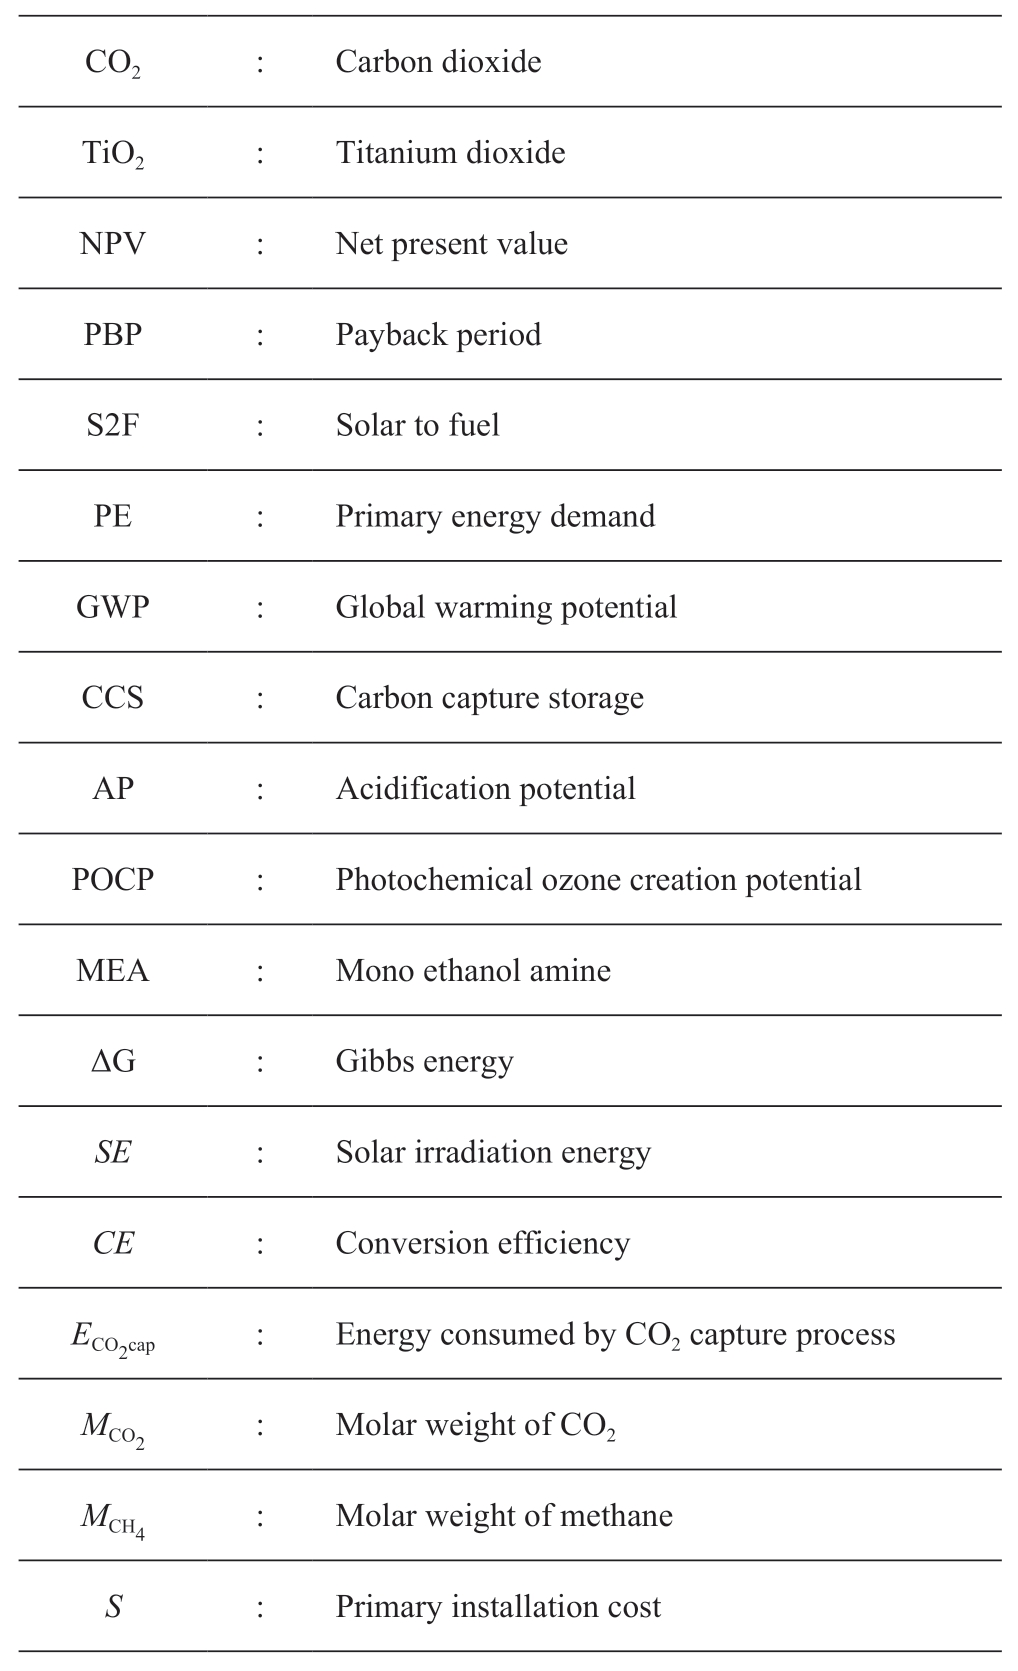
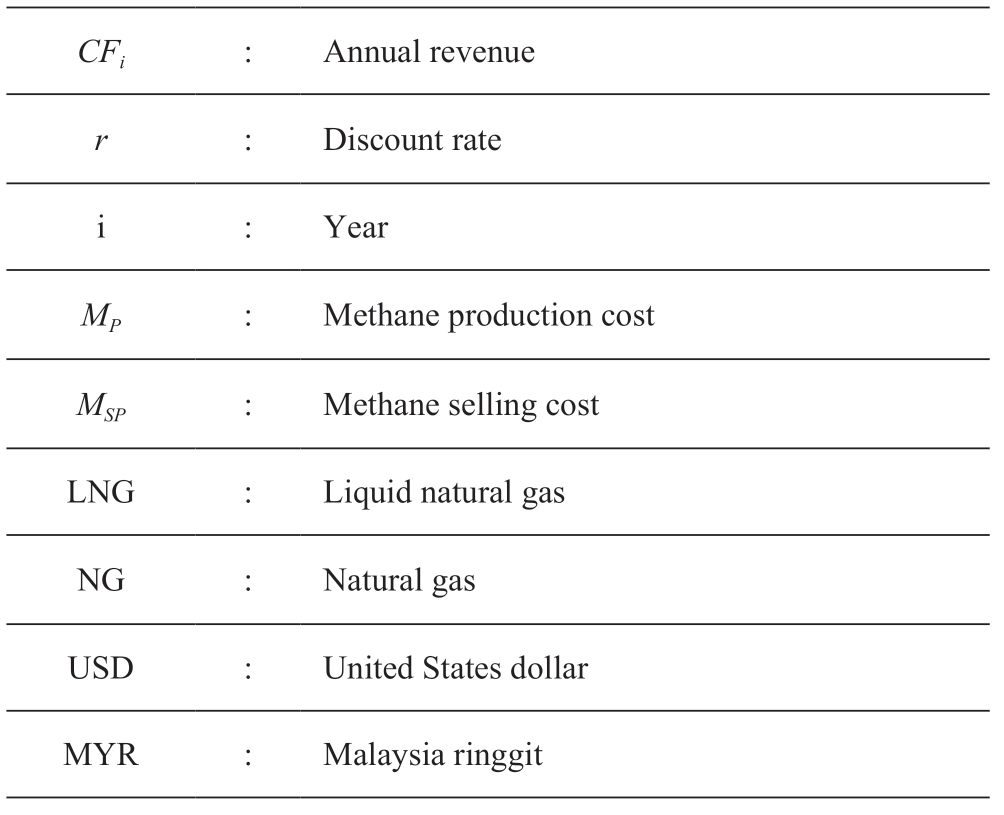
Nomenclature
Acknowledgements
The authors would like to acknowledge all the support from the Kyoto University and University of Malaya double degree programme to carry out this research.
Declaration of Competing Interest
We declare that we have no conflict of interest.
References
[1] Takase M, Kipkoech R, Essandoh P K (2021) A comprehensive review of energy scenario and sustainable energy in Kenya.Fuel Communications, 7: 100015
[2] Malek A B M A, Hasanuzzaman M, Rahim N A (2020)Prospects, progress, challenges and policies for clean power generation from biomass resources.Clean Technologies and Environmental Policy, 22(6): 1229-1253
[3] World Meteorological Organization (WMO) (2019) Greenhouse gas concentrations in atmosphere reach yet another high,https://public.wmo.int/en/media/press-release/greenhouse-gasconcentrations-atmosphere-reach-yet-another-high.Accessed 25 Nov.2019
[4] Saha S, Ruslan A R M, Monjur Morshed A K M, et al.(2021)Global prospects and challenges of latent heat thermal energy storage: a review.Clean Technologies and Environmental Policy,23(2): 531-559
[5] Petit J R, Jouzel J, Raynaud D, et al.(1999) Climate and atmospheric history of the past 420,000 years from the Vostok ice core, Antarctica.Nature, 399(6735): 429-436
[6] IPCC (2007) Climate Change 2007: Synthesis Report.Contribution of Working Groups I, II and III to the Fourth Assessment Report of the Intergovernmental Panel on Climate Change.https://www.ipcc.ch/pdf/assessment-report/ar4/syr/ar4_syr_full_report.pdf.2007
[7] REN21 (2017) Advancing the Global Renewable Energy Transition.https://sdg.iisd.org/commentary/guest-articles/advancing-the-global-renewable-energy-transition/.Accessed 18 July 2017
[8] Malik P, Awasthi M, Sinha S (2021) Techno-economic and environmental analysis of biomass-based hybrid energy systems:A case study of a Western Himalayan state in India.Sustainable Energy Technologies and Assessments, 45: 101189
[9] Fuentes M K (1984) Thermal modeling of residential photovoltaic arrays.Proceedings of the IEEE Photovoltaic Specialists Conference, 1341-1346
[10] World Bank (2020) State and Trends of Carbon Pricing 2020,Washington, DC.Doi: 10.1596/978-1-4648-1586-7
[11] Tanaka Y, Hasanuzzaman M (2018) A review of global current techniques and evaluation methods of photocatalytic CO2 reduction.Proceedings of the 5th IET International Conference on Clean Energy and Technology
[12] Fujishima A, Honda K (1972) Electrochemical photolysis of water at a semiconductor electrode.nature, 238(5358): 37
[13] Protti S, Albini A, Serpone N (2014) Photocatalytic generation of solar fuels from the reduction of H2O and CO2: a look at the patent literature.Physical Chemistry Chemical Physics, 16(37):19790-19827
[14] Dey G R, Belapurkar A D, Kishore K (2014) Photo-catalytic reduction of carbon dioxide to methane using TiO2 as suspension in water.163: 503-508
[15] Habisreutinger S N, Schmidt-Mende L, Stolarczyk J K(2013) Photocatalytic reduction of CO2 on TiO2 and other semiconductors.Angewandte Chemie International Edition,52(29): 7372-7408
[16] Karamian E, Sharifnia S (2016) On the general mechanism of photocatalytic reduction of CO2.Journal of CO2 Utilization, 16:194-203
[17] Kaneco S, Shimizu Y, Ohta K, et al.(1998) Photocatalytic reduction of high pressure carbon dioxide using TiO2 powders with a positive hole scavenger.2: 3-6
[18] Usubharatana P, McMartin D, Veawab A, et al.(2006)Photocatalytic process for CO2 emission reduction from industrial flue gas streams.Industrial & engineering chemistry research,45(8): 2558-2568
[19] Ola O, Maroto-Valer M M (2015) Review of material design and reactor engineering on TiO2 photocatalysis for CO2 reduction.Journal of Photochemistry and Photobiology C: Photochemistry Reviews, 24: 16-42
[20] Liu L, Zhao H, Andino J M, et al.(2012) Photocatalytic CO2 reduction with H2O on TiO2 nanocrystals: Comparison of anatase,rutile, and brookite polymorphs and exploration of surface chemistry.ACS Catalysis, 2(8): 1817-1828
[21] Abdel-Maksoud Y, Imam E, Ramadan A (2016) TiO2 solar photocatalytic reactor systems: Selection of reactor design for scale-up and commercialization—Analytical review.Catalysts, 6:138
[22] Trudewind C A, Schreiber A, Haumann D (2014) Photocatalytic methanol and methane production using captured CO2 from coalfired power plants.Part I-a Life Cycle Assessment.Journal of cleaner production, 70: 27-37
[23] Herron J A, Kim J, Upadhye A A, et al.(2015) A general framework for the assessment of solar fuel technologies.Energy &Environmental Science, 8(1): 126-157
[24] Pinaud B A, Benck J D, Seitz LC, et al.(2013) Technical and economic feasibility of centralized facilities for solar hydrogen production via photocatalysis and photoelectrochemistry.Energy &Environmental Science, 6(7): 1983-2002
[25] Mondal M K, Balsora H K, Varshney P (2012) Progress and trends in CO2 capture/separation technologies: a review.Energy,46(1): 431-441
[26] Korre A, Nie Z, Durucan S (2009) Life cycle modelling of fossil fuel power generation with post combustion CO2 capture.Energy Procedia, 1: 3771-3778
[27] Dey G, Pushpa K (2007) Formation of different products during photo-catalytic reaction on TiO2 suspension in water with and without 2-propanol under diverse ambient conditions.Research on Chemical Intermediates, 33(7): 631-644
[28] Alie C, Backham L, Croiset E, et al.(2005) Simulation of CO2 capture using MEA scrubbing: a flowsheet decomposition method.Energy conversion and management, 46(3): 475-487
[29] Kim J, Johnson T A, Miller J E, et al.(2012) Fuel production from CO2 using solar-thermal energy: system level analysis.Energy & Environmental Science, 5(9): 8417-8429
[30] OECD (2014) Average annual wages.https://stats.oecd.org/Index.aspx?DataSetCode=AV_AN_WAGE
[31] Department of Statistics, Malaysia (2017) Salaries & wages survey report, Malaysia, 2017: the office of chief statistician Malaysia, https://www.dosm.gov.my/v1/index.php?r=column/pdf Prev&id=NzFoZURoenJHeFBhdCt0bXJFOWY3dz09
[32] National Chamber of Agriculture (Japan) (2018) Survey results on field sales price in 2017.https://www.nca.or.jp/
[33] Hosenuzzaman M (2016) Energy, economic and environmental analyses of a solar energy based power generation under Malaysia conditions.Dessertation, Institute for Advanced Studies,University of Malaya, Malaysia
[34] Ohtani B (2010) Photocatalysis A to Z-What we know and what we do not know in a scientific sense.Journal of Photochemistry and Photobiology C: Photochemistry Reviews, 11: 157-178
[35] Herron J A, Kim J, Upadhye A A, et al.(2015) A general framework for the assessment of solar fuel technologies.Energy& Environmental Science, 8: 126-157
[36] Almaktar M A, Mahmoud H Y, Daoud E Y, et al.(2017)Meteorological Parameters in Malaysia: An Investigation Between Real Measurements and NASA Database.Advanced Electrical and Electronics Engineering and Scientific Journal, 1
[37] Royne A, Dey C J, Mills D R (2005) Cooling of photovoltaic cells under concentrated illumination: a critical review.Solar Energy Materials and Solar Cells, 86(4): 451-483
[38] Malek A B M A, Hasanuzzaman M, Rahim N A, et al.(2017)Techno-economic analysis and environmental impact assessment of a 10 MW biomass-based power plant in Malaysia.Journal of Cleaner Production, 141: 502-513
[39] Abdul M A, Hasanuzzaman M, Rahim N A, et al.(2021) Energy,economic, and environmental analysis of 10-MW biomass gasification based power generation in Malaysia.Energy &Environment, 32(2): 295-337
[40] Orioli A, Gangi A D (2015) The recent change in the Italian policies for photovoltaics: Effects on the payback period and levelized cost of electricity of grid-connected photovoltaic systems installed in urban contexts.Energy, 93: 1989-2005
[41] Malek A A, Kawsary M, Hasanuzzaman M (2022) Economic assessment of solar thermal energy technologies.Technologies for Solar Thermal Energy: Theory, Design and, Optimization.Academic Press, Washington, DC, 293-322
[42] World Bank (2019) State and Trends of Carbon Pricing,Washington, DC, Doi: 10.1596/978-1-4648-1435-8.2019
[43] Statista (2021) Carbon taxes worldwide by select countries,https://www.statista.com/statistics/483590/prices-ofimplemented-carbon-pricing-instruments-worldwide-by-selectcountry/.Accessed 13 Mar 2022
[44] Gasprice (2018) Monthly price.http://www.worldbank.org/en/research/commodity-markets
[45] RPGP (2018) Regulated piped gas price.http://www.st.gov.my/images/article/industry/2018/TPA/Feb/1._Regulated_piped_gas_prices_as_of_Feb_2018.pdf
[46] Scheffknecht G, Al-Makhadmeh L, Schnell U, et al.(2011) Oxyfuel coal combustion—A review of the current state-of-the-art.International Journal of Greenhouse Gas Control, 5: S16-S35
[47] Aleksandrov Y I, Korchagina E, Chunovkina A (2002) New generalization of data on the heat of combustion of high-purity methane.Measurement Techniques, 45(3): 268-273
[48] DiStefano T D, Palomar A (2010) Effect of anaerobic reactor process configuration on useful energy production.Water research, 44(8): 2583-2591
[49] Anis W, Mertens R, van Overstraeten R (1984) Calculation of solar cell operating temperature in a flat plate PV array.Proceedings of Photovoltaic solar energy conference, 520-524
[50] Fuentes M (1984) Thermal modeling of residential photovoltaic arrays.Sandia National Labs., Albuquerque, NM (USA)
[51] Lee W, Infield D, Gottschalg R (2001) Thermal modelling of building integrated PV systems.Proceedings of International Solar Energy Society UK Section-Conference-C
[52] NREL, Solar Spectral Irradiance: ASTM G-173.https://www.nrel.gov/grid/solar-resource/spectra-am1.5.html
Received: 13 August 2021/ Accepted: 10 March 2022/ Published: 25 April 2022
M.Hasanuzzaman
hasan@um.edu.my
Yudai Tanaka
tanaka.yudai.33v@kyoto-u.jp
2096-5117/© 2022 Global Energy Interconnection Development and Cooperation Organization.Production and hosting by Elsevier B.V.on behalf of KeAi Communications Co., Ltd.This is an open access article under the CC BY-NC-ND license (http: //creativecommons.org/licenses/by-nc-nd/4.0/ ).
Biographies

Yudai Tanaka received B.Sc.of Engineering in the field of Engineering Science at Faculty of Engineering in 2016 from Kyoto University,Japan, M.Sc.of Energy Science in the field of Socio-Environmental Energy Science at Graduate school of Energy Science in 2019 from Kyoto University, and Master of Renewable Energy at Institute for Advanced Studies in 2019 from University of Malaya, Malaysia.Yudai Tanaka is currently working as Engineer at Nippon Steel Engineering Co.,LTD.His research interests include renewable energy, photocatalyst and energy policy.

M.Hasanuzzaman received B.Sc.in Mechanical Engineering in 2005 from Bangladesh University of Engineering and Technology (BUET), Bangladesh, M.Eng.Sc.and PhD from University of Malaya,Malaysia in 2008 and 2011 respectively.Dr.Md.Hasanuzaman is currently working as Associate Professor at the UM Power Energy Dedicated Advanced Centre, Higher Institution Centre of Excellence(HICoE), University of Malaya, Malaysia.He was listed among the World’s Top 2% Scientists for the years 2020 and 2021.He was Program Coordinator (Master of Renewable Energy, September 2012 to September 2020), Double Degree Programme with Master of Energy Science, Kyoto University, Japan. He is an Associate Editor of the Alexandria Engineering Journal, Elsevier; Associate Editor in Chief of the International Journal of Renewable Energy Resources;and has been a Guest Editor for Renewable Energy, Elsevier.He is an editor and author of the book Energy for Sustainable Development published by Elsevier.His research interests include thermal engineering, renewable energy, energy and buildings, energy policy,transport and electric vehicles.He received a University of Malaya Excellence Award in 2012 for his outstanding achievement in PhD;Bangladesh Scholarship Council and the Nippon Foundation, Japan,2003-2004.
(Editor Yajun Zou)
