0 Introduction
A microgrid is a small-scale power system that integrates loads, distributed energy resources (DERs), and distribution circuits to enhance energy supply efficiency and security and meet the local demands in dispersed areas [1-3].The optimal dispatching of a microgrid, which is typically achieved by optimizing the DER outputs to meet the load demands and complying with the operation constraints [4-6],aims to reduce the operational cost, enhance power supply reliability, and accommodate low-carbon DERs.
Microgrid dispatching is a complex high-dimensional nondifferentiable optimization problem, whose optimal solution is difficult to obtain using traditional methods.Metaheuristic algorithms are excellent owing to the advantages of finding acceptable solutions of most complex problems in a reasonable time and possessing a nonconvex and nondifferentiable tolerance [7-9].
At present, worldwide research on microgrid optimal dispatching is focused on model optimization, scheduling strategies, and intelligent algorithms.Commonly used algorithms are the particle swarm optimization (PSO)algorithm and its variants, which iteratively search the optimal solution and evaluate the solution quality using fitness factors [10].Reference [11] established a scheduling scheme for a microgrid to minimize the operation cost,greenhouse gas emissions, and voltage deviation of the generating units by employing PSO and dynamically updating the normalization factor during the optimization process.However, the PSO algorithm may be prone to falling into a local optimal solution that may not be the best solution.In [12], PSO was combined with a bacterial foraging algorithm to optimize a microgrid dispatching model with different weight coefficients.In the process,the multi-objective function considers the operating cost,voltage deviation, and peak shaving and valley filling capabilities.However, the study ignored important environmental factors such as pollutant emissions.In[13], a quadratic programming algorithm and PSO were combined to minimize the operational and outage costs of a microgrid.Moreover, the optimal solution of the masterslave objective function based on the net present value was identified from a pareto curve using a fuzzy logic and the PSO iterative process.Reference [14] proposed a real-time optimal microgrid dispatching scheme that uses a multiobjective genetic algorithm to dispatch DERs and the utility grid in an economic and environmentally friendly manner.However, the aforementioned algorithms may have low convergence accuracy, and the requirement of numerous iterations, as shown by their simulation results, is also a challenge for their processing speed.
The bird swarm algorithm (BSA), a new bio-heuristic optimization algorithm, is inspired by bird behaviors of foraging, vigilance, and flight as well as the mechanism learning for information searching and sharing during their foraging process.In the BSA, swarm intelligence can be efficiently extracted from bird swarms for optimization.The BSA is suitable for solving different optimization problems such as data optimization in a microgrid project and its economic issues [15] and optimization of projection pursuit regression model parameters [16].It has been verified that the BSA is superior to the PSO and differential algorithms in general optimization processes [9].However, the convergence accuracy of the BSA may deteriorate or even fall into a local optimum when optimizing small portions of multi-extremum functions.
Levy flight (LF) [17] is an ideal approach by which creatures forage in an unknown environment, involving frequent short-range searches and occasional long-range jump searches to enhance the foraging efficiency.LF strategy has been successfully applied to bionics intelligent algorithms such as the cuckoo [18] and PSO [19] algorithms,and it has achieved good optimization results.However, LF is rarely used in the BSA.
Based on the above discussion, the main innovation contribution of this paper is the proposal of a self-adaptive LF strategy-based BSA (LF-BSA) for a microgrid based on (0,1) random uniform distribution, linear adjustment,and LF strategies.It can be efficiently and accurately used for microgrid optimization and to provide a new solution for the power system optimization problem.The (0,1)random uniform distribution strategy adaptively selects inertia weight, and the linear adjustment strategy linearly adjusts learning coefficients to balance the global and local search abilities, thereby improving the convergence speed and search accuracy of the BSA.The LF strategy updates the spatial positions of bird groups, thereby expanding the search range, enriching the population diversity, and enabling jumping out of a local optimal solution of the optimization problem.
The remainder of this paper is organized as follows.Section 1 introduces the dispatch modes for a typical microgrid.Section 2 describes the basic theory of the BSA,inertia weight, and LF behavior.Section 3 presents the proposed LF-BSA, its applications in microgrid optimal dispatching, and its comparison with three commonly accepted algorithms.In Section 4, a case study on an existing microgrid in a real energy scenario was conducted to verify the feasibility of the LF-BSA and analyze of the effectiveness of the multi-objective optimal microgrid dispatching and its detailed costs are discussed.Section 5 draws the conclusions.
1 Microgrid dispatching optimization model
A candidate microgrid with a ring topology is illustrated in Fig.1, which consists of photovoltaic cell (PV), wind turbine (WT), micro turbine (MT), fuel cell (FC), and battery storage (BT).A proton exchange membrane FC is employed in this study to only generate electricity.The PV and the WT operate in a maximum power point tracking mode, and the MT works in a “cold/heat-ordered power”mode.The BT is controlled to balance the generation and demand imbalance that arises under load variations as well as the DER power fluctuations that are caused by the uncertainty of the source load.The microgrid operation is monitored by an energy management system (EMS in the figure) by a ZigBee or wireless mesh network, which is regarded as a state-of-art communication technology for smart grids [20-22].
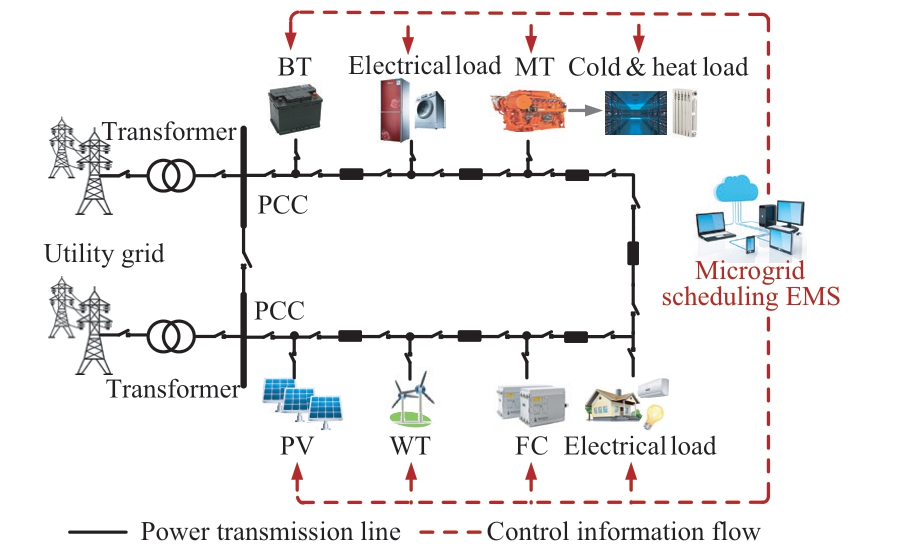
Fig.1 Schematic diagram of the candidate microgrid
The dispatching optimization model is introduced in the following subsections in terms of the objective function,constraints, and dispatching strategy.
1.1 Objective function
This subsection introduces the least economic cost(Econ.) mode, least environmental cost (Env.) mode, and optimally combined economic and environmental cost(Comb.) mode for microgrid dispatching.
1.1.1 The Econ.mode
This mode emphasizes the cost reduction for DER scheduling.The objective function of the Econ.mode is expressed as follows [23, 24]:
where CC-Cost is the total economic cost; CFuel, COM, CDP,CGrid, and CL are the microgrid total fuel cost, operation and maintenance cost, depreciation cost, energy transaction cost with the utility grid, and load shedding cost, respectively;and a, b, c, d, and e are binaries of 1 or 0, where d = 0 indicates the microgrid island mode.
1.1.2 The Env.mode
The PV and the WT do not emit air pollutants, and the chemical pollution of the BT is negligible.The air pollutants that are emitted by the FC and the MT in the microgrid are mainly CO2, SO2, and NOx [23, 24].The Env.mode sorts the generating ranking order by comparing the air pollution penalization costs of the generation fuel types and the utility grid.Therefore, it prioritizes the utilization of the BT power with zero air pollutant emission.The objective function of the Env.mode is expressed as follows:
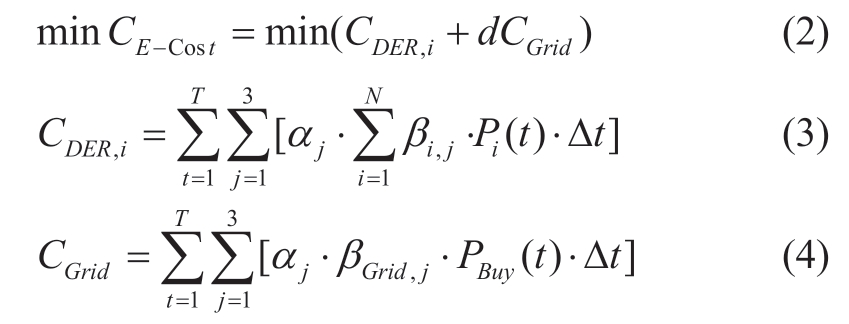
where CE-Cost is the total air pollution penalization cost;CDER,i and CGrid are the air pollution penalization costs for the i-th DER and the utility grid, respectively; T is the operating cycle; aj is the unit air pollution penalization cost for class j pollutant; βi,j and βGrid,j are the pollutant emission coefficients for class j pollutant of the i-th DER and the utility grid,respectively; Pi(t) and PBuy(t) are the output power of the i-th DER and the purchased power from the utility grid at time t,respectively; and Δt is the dispatching time interval.
1.1.3 The Comb.mode
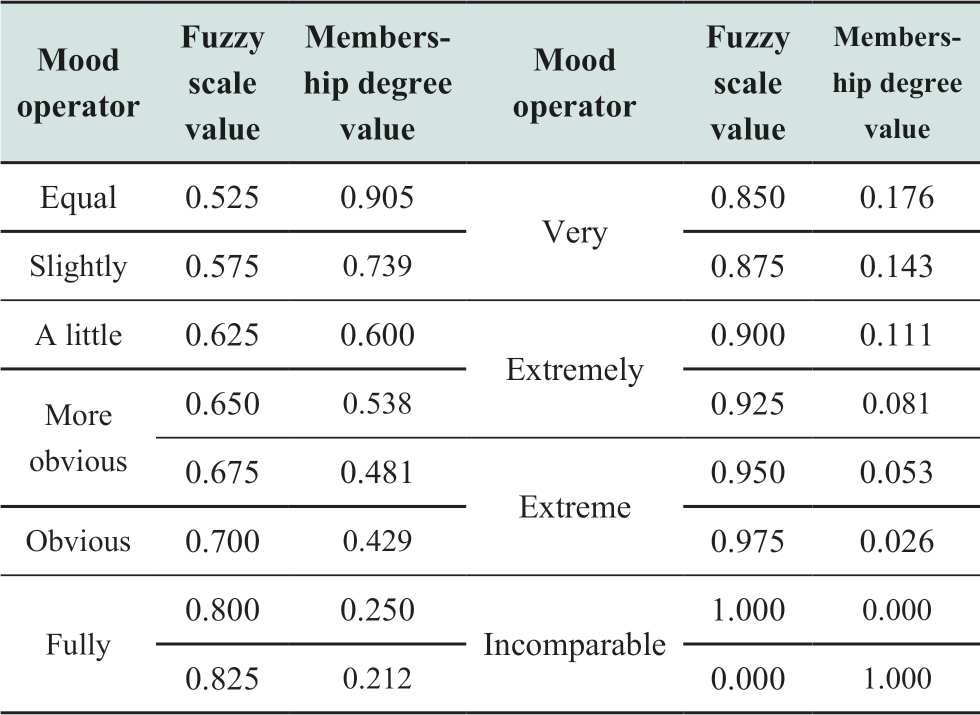
The Comb.mode considers the dual objective functions of economy and environment expressed in (1)-(4).The interactions between the objectives make it challenging for them to simultaneously achieve optimization.In this study, the dualistic factor contrast method introduced in [24, 25] is employed to transform the multi-objective model into a single-objective model by adding the cost weight coefficients of the Econ.and Env.modes.First,the importance qualitative ranking scale matrix, E, is established.Second, the consistency test of E is conducted,and the importance levels of the objective functions are determined.Finally, based on the conversion relationship in Table 1, the fuzzy mood operator is converted into non-normalized weight vectors of the membership index,and the weight vectors of the available index (weight coefficients) can be obtained after normalization.Therefore,the corresponding objective function for the Comb.mode is expressed as follows:
Table 1 The relation between mood operator and fuzzy scale and membership degree

where C is the comprehensive cost and  and
and  are the economic and environmental weight coefficients,respectively.When a mixed feeder supplies domestic,commercial, industrial, and other activities, if there is an abrupt and large decrease in the load, optimization can be achieved by selecting different weighting factors.
1.2 Constraints
(1) Power balance:
where PL(t) is the system load at time t; PBT(t) is the BTcharging/discharging power at time t; PPV(t), PWT(t), PFC(t),PMT(t), and PGrid(t) are the outputs of the PV, WT, FC, MT,and microgrid power exchange with the utility grid at time t,respectively.If PGrid(t) > 0, the microgrid purchases power;if PGrid(t) < 0, the microgrid sells power.
(2) DER power constraints:
where Pi,max and Pi,min are the upper and lower active power limits of the i-th DER, respectively.
(3) Microgrid power transfer constraints:
where PGrid,max and PGrid,min are the upper and lower limits of the microgrid power transfer capability to the utility grid,respectively.
(4) BT charge and discharge constraints:
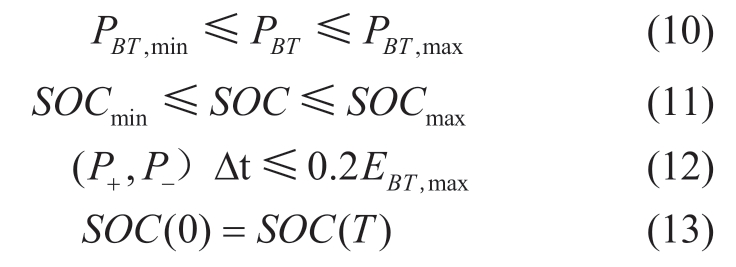
where PBT,max and PBT,min are the upper and lower power limits of the BT, respectively; SOCmax and SOCmin are the upper and lower limits of the state of charge (SOC), respectively;P- and P+ are the charging and discharging power of the BT per unit time, respectively; EBT,max is the energy capacity of the BT; and SOC(0) and SOC(T) are the starting and ending SOC of the BT per dispatch cycle, respectively.To extend the life of the BT, its hourly charge and discharge rates can be set less than or equal to 0.2 × EBT,max per hour.
1.3 Microgrid operation under time-of-use electricity prices
Based on the grid generation and demand imbalance level, electricity can be priced in three categories for purchase and sale: peak, valley, and level times.Compared to the prices in the valley and level times, the price in the peak time is relatively higher owing to the start of more power generation [14].
Microgrid generation dispatching continuously deals with its power consumption, the costs of the various DERs and the BT, and the utility grid electricity price.Considering all these cost elements, the microgrid is generally scheduled aiming to sell more electricity during peak time at higher prices and purchase more electricity during the valley time at lower prices to meet the demand.
2 BSA scheme, inertia weight, and LF behavior
This section introduces the BSA scheme, inertia weight,and LF behavior, respectively.
2.1 BSA scheme for microgrid optimal dispatching
As illustrated in Fig.2, the BSA is a bio-heuristic algorithm derived from the foraging, vigilance, and flight behaviors of birds.The essence of these social behaviors and activities is known as swarm intelligence [9].In the microgrid optimization process, the position for each bird in a defined swarm corresponds to a potential solution for each DER (In the BSA, the utility grid is treated similar to a DER; therefore, it can also be accounted in the optimization process.).
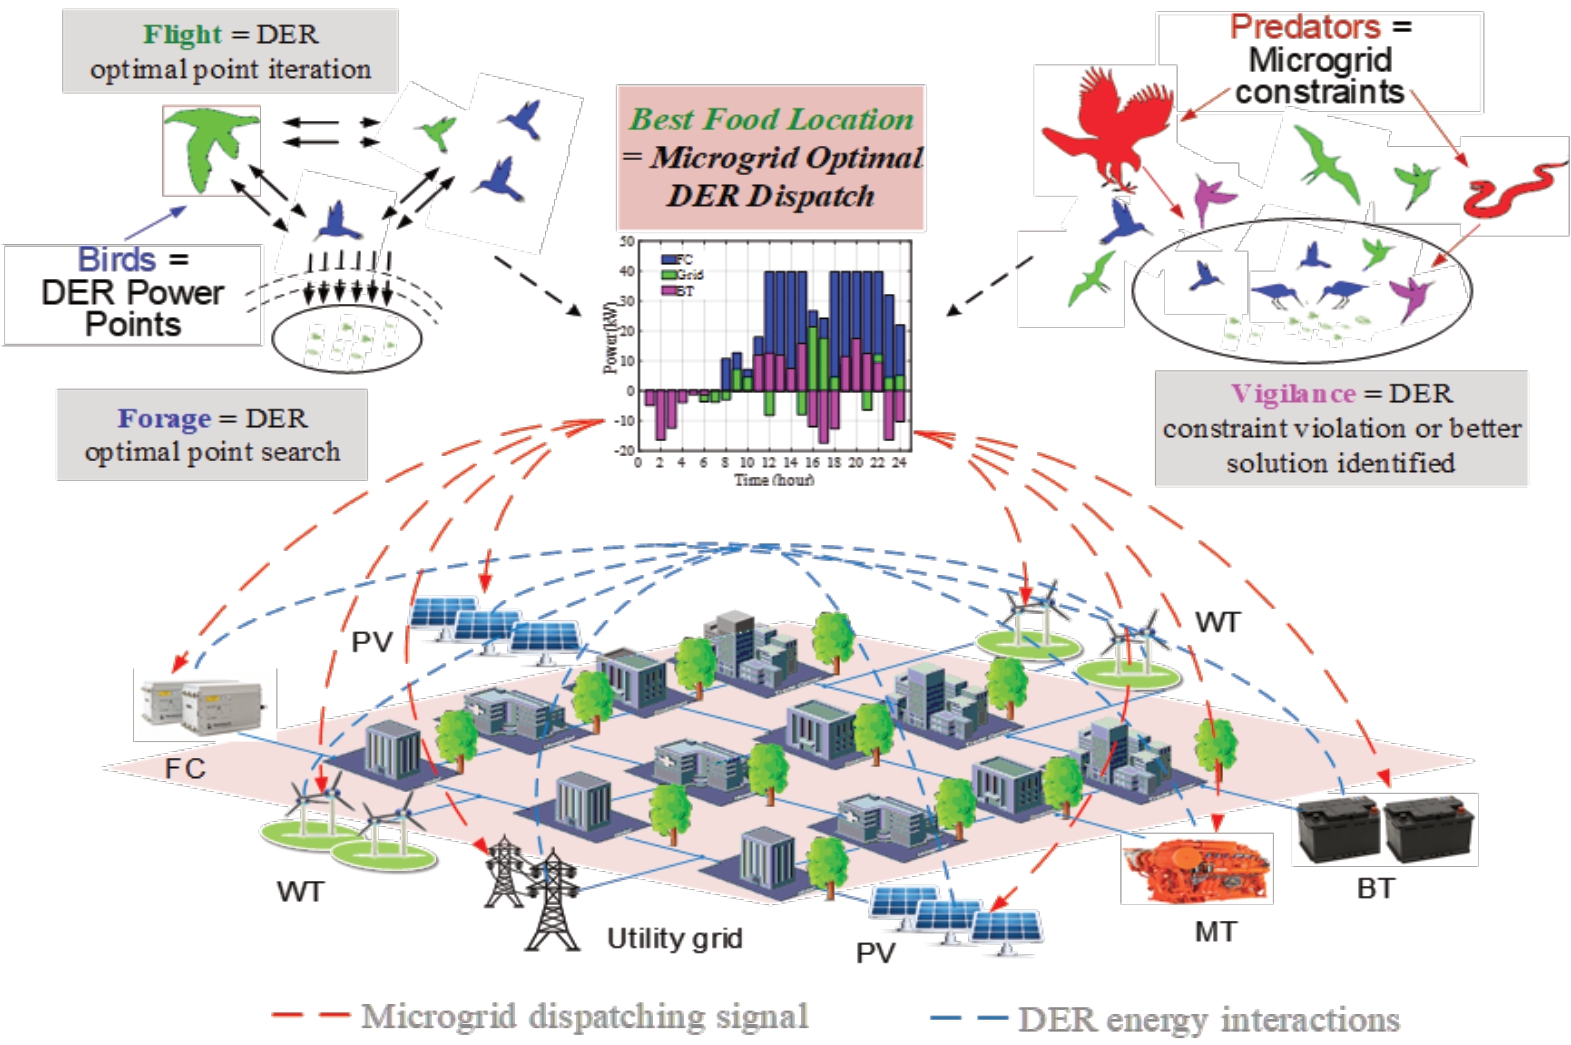
Fig.2 BSA behavior and its application in microgrid
The BSA involves bird population size N (which corresponds to the selectable number of solutions) and space-time dimension D of the optimization process (which corresponds to the number of unknowns of each DER in the microgrid).Moreover, it includes  (i∈[1, …, N]), which represents the foraging or flight position of the i-th bird at time t, corresponding to the i-th DER power operating point.The three key behaviors-“foraging,” “vigilance,” and“flight”-are introduced in the following subsections.
2.1.1 Foraging behavior
The foraging behavior of each bird represents the search process for the optimal operating point (food) for a specific DER.The i-th bird searches for food following its own and colonial experiences.The mathematical expression of the foraging behavior of a bird is as follows:

where j∈[1,..., D];  and xt+1 i,j are the DER power point positions at time t and t+1, respectively; pi,j is the optimal position of i-th bird (i-th DER) in j-th dimensional birds group space; rand (0,1) is an independent random number used to test the possibility P (P∈(0,1)) of bird vigilance.If rand(0,1) < P, the bird is set to forage, otherwise it remains vigilant; C and S (C, S > 0) refer to the cognitive coefficient (self-learning) of its own experience and the group coefficient (external learning) of its colonial experience, respectively; gj is the optimal group position in j-th dimensional bird group space (optimal solution of the objective function in the microgrid).
In the early stage of the search, large cognitive coefficients can cause particles to search for the global optimal solution in the solution space at a high speed,resulting in jumping out of the local optimal solution.In the later stage of the search, larger external learning factors can improve the local search of the particles near the optimal solution [26].
2.1.2 Vigilance behavior
Vigilance of a bird reflects the ability of its corresponding DER to reach the power constraints.Birds send out warning messages when detecting dangerous species such as eagles and snakes, indicating a DER constraint violation.Moreover, the warning message from a vigilant bird informs the other birds in the group to fly away and start searching for another foraging position,which indicates the search for a new microgrid dispatching solution.
Vigilance also reflects the level of the foraging competition for the DERs among the bird population, i.e.,the degree of the microgrid optimization convergence.A bird with inferior competitiveness may remain vigilant on the periphery, i.e., its corresponding DER power temporarily remains under its constraint limit.In contrast, competitive birds fly to the center of the population, which refers to the corresponding DER power returning from the constraint and the start of another optimal solution search.
Interestingly, birds during foraging typically raise their heads and check their surroundings, collect to inform each other about the threat of a predator, and prepare to fly from the current periphery to the population center of a safer position when observing any danger.The BSA also mimics the interference of a bird flight, i.e., a bird flight may be disturbed by predators or a bird may compete with the other birds when attempting to fly to the population center.
The aforementioned behaviors are included in the BSA for microgrid dispatching as follows:
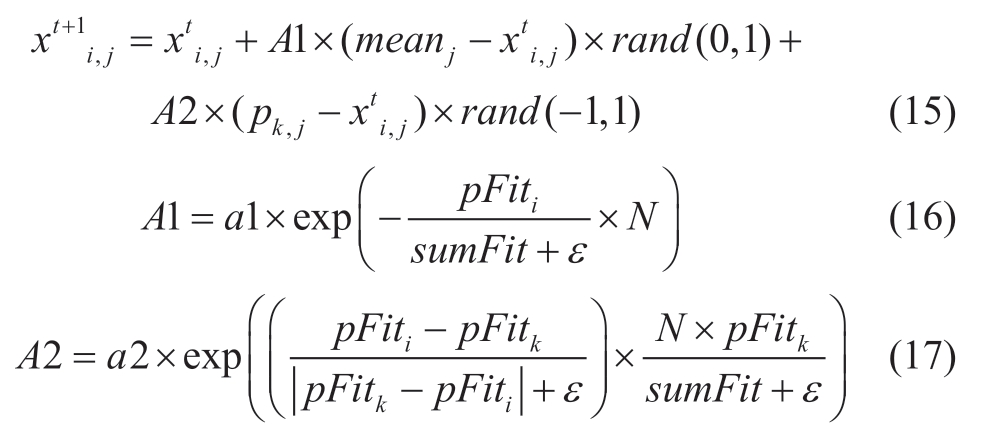
where i and k (k≠i) are i-th bird and k-th bird, respectively,which is between [1,N]; A1 is the indirect effects caused by the predator’s pursuit (the DER power constraints in the microgrid); A2 is the direct effects caused by the inter-group competition (the comparing computation of all the DER power point positions for a new optimal solution); meanj is the average bird position in j-th dimensional birds group space (average DER power point of j-th DER); pk,j is the optimal position of k-th bird (k-th DER) in j-th dimensional birds group space; a1 and a2 are two positive constants in[0, 2]; pFiti and pFitk are the best fitness value of the competing i-th bird and k-th bird respectively, i.e.the best fitness values of objective function for i-th DER and k-th DER in optimal solution search; sumFit is the sum of the best fitness values of the group (the optimal value of objective function for all the DER power points); ε is the smallest constant in the EMS computer server used to avoid zero-segmentation in (16) and (17).
2.1.3 Flight behavior
The flight of a bird group, which represents new searching iterations for the microgrid optimization solution,occurs at the vigilance of any bird (the violation of a certain DER constraint) and the search of another premier position for better foraging (search for new solutions with higher constraint margins or search at fixed intervals).
During flight, birds with higher foraging efficiency(known as bird producers) may first identify new foraging spots and inform the birds with lower foraging efficiency(known as bird beggars).The flight behaviors of the bird producers and beggars are expressed respectively as:

where i and k are the i-th bird producer and the k-th bird beggar, respectively and
and  are the foraging positions of the i-th bird producer and the k-th bird beggar at time t in j-th dimensional bird group space, respectively; xt+1 i,j and
 are the foraging positions of the i-th bird producer and the k-th bird beggar at time t + 1 in j-th dimensional bird group space, respectively; randn(0,1) is a random number in a Gaussian function obeying a mean value of zero and a standard deviation of one; and FL (FL∈[0,1]) is the probability that the bird beggars follow the bird producers in the flight process.
2.2 Inertia weight
Inertia weight w, which is typically employed in PSO,defines the capability of a particle to change its previous state.A large w implies a high global search capability,whereas a small value implies a high local search capability.The expression of the traditional “single variable with iteration” inertia weight is [27]:
where wmax and wmin are the maximum and minimum w values, respectively, a is an index that controls the speed of the reduction in w, t is the current iteration number, and tmax is the maximum number of iterations.When the birds find the optimal value in the early stage of the search, a large w is required to rapidly converge, and the decreasing w reduces the convergence speed.However, if the optimal value is found in the later stage of the search, then w and the bird flying speed are very small, and the BSA can easily fall into a local optimal value.
2.3 LF behavior
In LF behavior, the random walk characteristics of a short-range frequent search and a long-range infrequent skip search correspond to the local and global solution searches of the DERs in the microgrid.LF behavior ensures the local search accuracy and enhances the global search capabilities.Simultaneously, it can also expand the search space.
When birds fly to another area, the above-mentioned random walk mode can be used to update their flight positions.The step sizes of the random walk mode are extracted from an LF distribution according to a power law[17].The LF distribution expression, Levy(λ), in a twodimensional plane is:
where u is the step size, l is the LF length, and λ is the variance.Because λ varies randomly between 1 and 3,step size u has an infinite variance, which enhances the optimization efficiency.
3 The LF–BSA-based microgrid dispatching scheme and its validation and comparison
The challenges of the traditional BSA introduced in Section 2 are deemed to be lower accuracy and lead to premature local convergence [9].Therefore, to improve the BSA optimization performance and solve the multiextremum microgrid dispatching problems, this section proposes an LF-BSA and also discusses its implementation process in microgrid optimal dispatching.Moreover,taking six typical test functions including high- and lowdimensional functions as examples, the superiority of the LF-BSA compared to three commonly accepted algorithms is presented.
3.1 LF–BSA scheme
3.1.1 “Adaptive” inertia weight for bird foraging
To balance the global and local search capabilities of the BSA, an adaptive inertia weight w is proposed by adopting a (0,1) random uniform distribution strategy, allowing w to be flexibly selected in the searching process of the optimal solution.When the value interval of w is [0.4, 0.9], the optimization algorithm is effective [26].The corresponding adaptive inertia weight is expressed as:
where pFit and fMin are the individual and group optimal values, respectively.
Compared to the traditional “single variable with iteration” w in (20), w in (22) can obtain larger values and perform a global or local search in the initial or later stage,to improve the convergence speed and restrain the algorithm to achieve a local optimum.
3.1.2 “Time-varying” cognitive and group coefficients for bird foraging
This paper proposes “time-varying” cognitive and group coefficients of bird behavior by adopting a linear adjustment strategy, to enhance the BSA local and global foraging capabilities.The strategy introduces improvements of C and S in(14) in the BSA.The new coefficient expressions are as follows:

where Cs and Ce are the starting and ending values of the cognitive coefficients, respectively, and Ss and Se are those of the group coefficients, respectively.
3.1.3 LF strategy for bird flight
The continuous jump path, Levy(λ), obeys the levy distribution, and when calculating Levy(λ), the Mantegna algorithm is typically used to represent it (random levy step)[18,19] as follows:
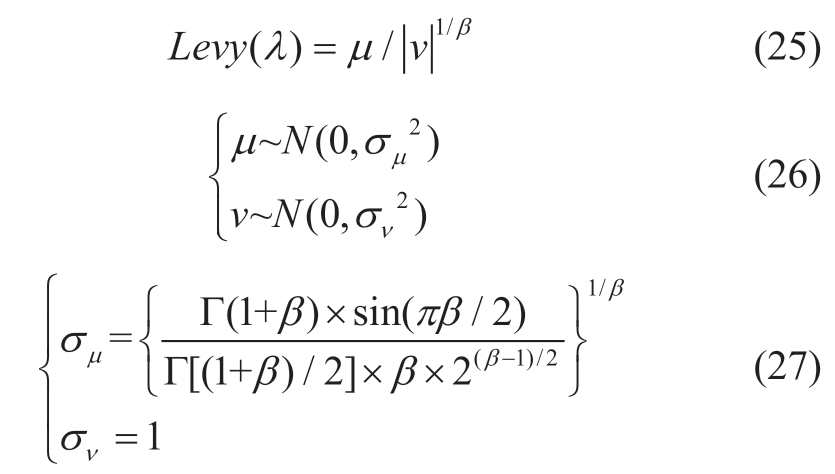
whereμ and ν are normal distributions (σμ and νσ are the corresponding standard deviations), β is a distribution parameter between (0, 2), and Г is a standard γ function.
The LF strategy expressed in (25)-(27) is iterated 500 times to investigate its search range.The corresponding variation in the LF step size is shown in Fig.3, which presents its appropriate balance of short-, medium-, and long-range search times.
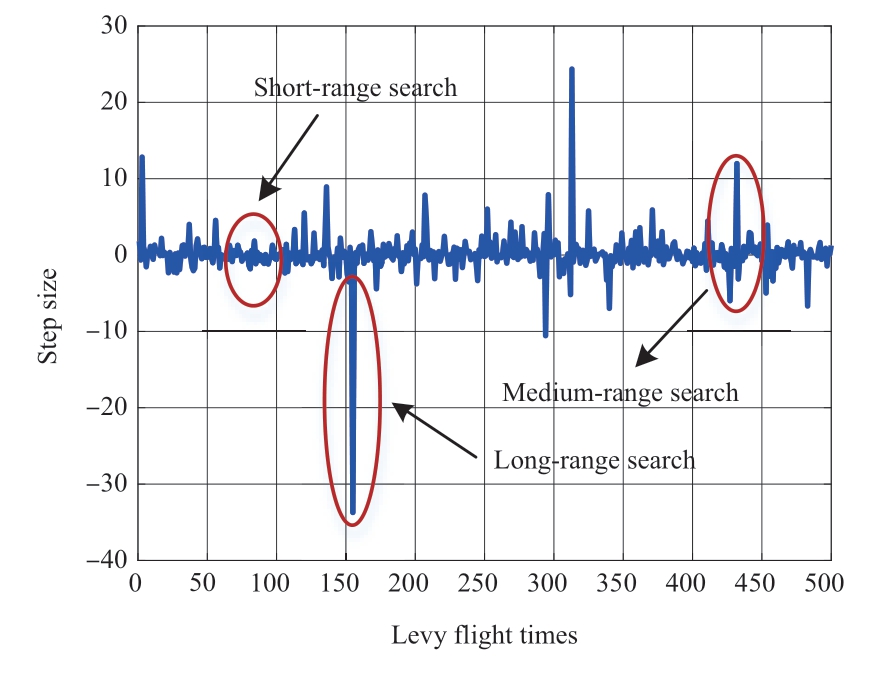
Fig.3 Levy flight step distribution map
Owing to the above improvements, there are many variable parameters, such as w.For different optimization problems, it is necessary to readjust the parameters to ensure satisfactory performance.
The adaptive inertia weight proposed in (22) and the time-varying learning coefficients proposed in (23) and(24) are added to the BSA in (14), forming the improved bird foraging behavior.The corresponding expression is as follows:

The LF strategy introduced in (25)-(27) are added to the BSA in (18), expressing the improved flight behavior of a bird producer as follows:
where ⊕ denotes a vector multiplication.
In summary, the LF-BSA scheme is developed based on improvement in the foraging and flight behaviors of the BSA.
3.2 Implementation of LF–BSA for microgrid dispatching
In the microgrid optimization process, the LFBSA requires the microgrid parameters as inputs, which are classified into physical and algorithm calculation parameters.The physical parameters include the load level,energy prices, pollutant emission penalization coefficients,and basic data of the DERs (including information on the DER capacities, operational and maintenance costs, capacity factor, depreciation period, and initial construction cost).The algorithm parameters include some constant parameters(e.g., a1 = a2 = 1.5 in (16) and (17)), population size N (e.g.,200 in the energy scenario in this study), maximum iteration number (e.g., 2000 in the energy scenario in this study), and space-time dimension D (e.g., 24 in the energy scenario in this study).
After all parameters are set in the LF-BSA, the computation process is executed following the flowchart shown in Fig.4.The initial DER power point corresponds to the spatial position,  of each bird in the swarm.The objective functions in (1), (2), and (5) are iterated to search for the optimal foraging locations, and xt i,j is constantly updated by the proposed LF-BSA.Until the optimal foraging position (corresponding to the optimal DER power operating point) is found, the optimization results of the optimal Econ., optimal Env., and optimal Comb.modes can be achieved.
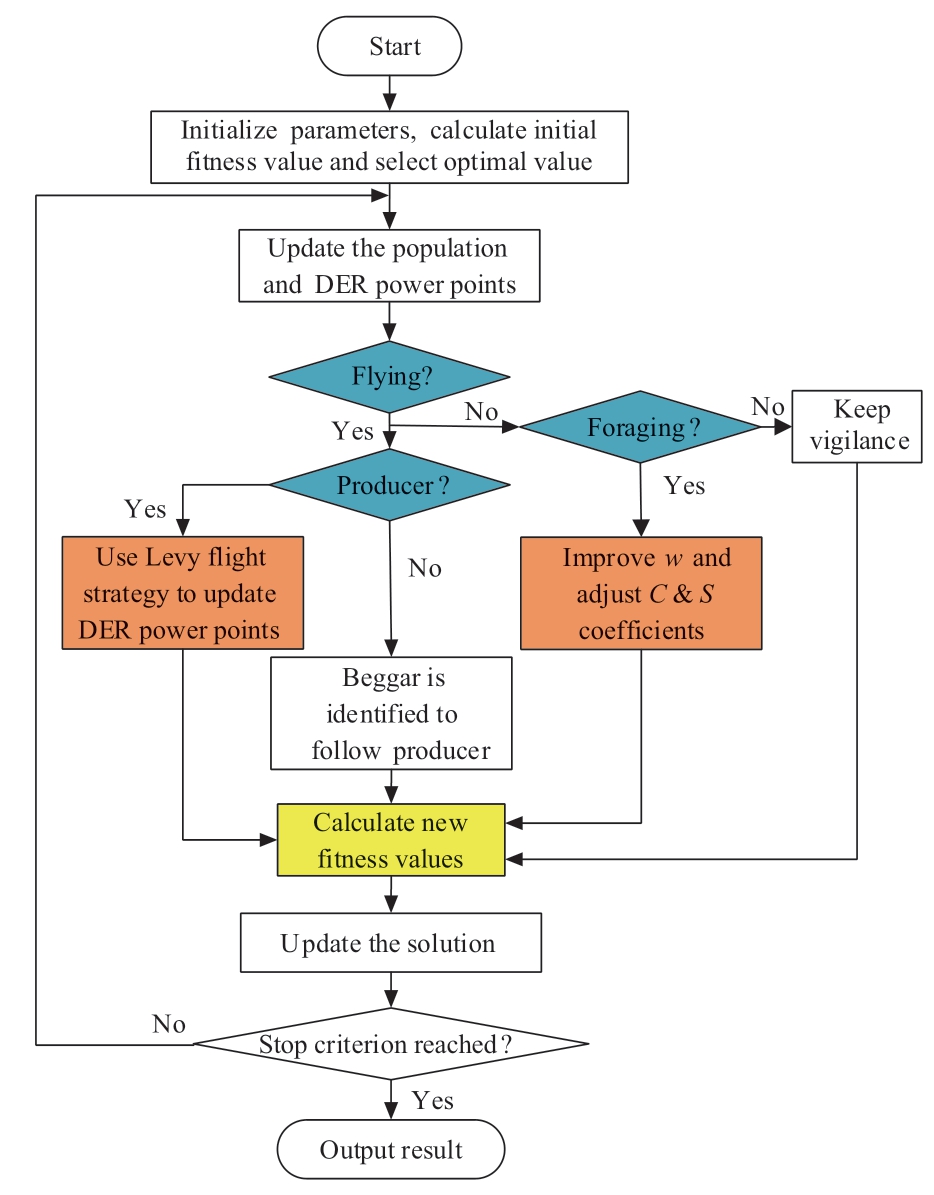
Fig.4 Flow chart of microgrid optimization dispatching based on LF-BSA
3.3 Validation and comparison
As listed in Table A1 in Appendix A, six typical benchmark test functions including high- and low-dimensional functions [28] are used to compare the convergence accuracy,stability, and speed of the LF-BSA to those of the BSA, PSO,and improved PSO (IPSO).The related parameters of each algorithm are listed in Table A2 in Appendix A.Among them, Vmax and Vmin are the upper and lower speed limits,respectively, of both PSO and IPSO.To obtain statistical results, in all algorithms, population size N is set as 50 and the number of iterations is set as 1000, and all algorithms are implemented for 20 independent trials.
The obtained optimal values, mean values (represent the convergence accuracy), and standard deviations (represent the convergence stability) are listed in Table 2.The optimal individual fitness value curves (convergence curves) of the convergence speed and accuracy of the four algorithms are shown in Fig.5.
Table 2 Comparison of statistical results obtained by PSO,IPSO, BSA and LF-BSA
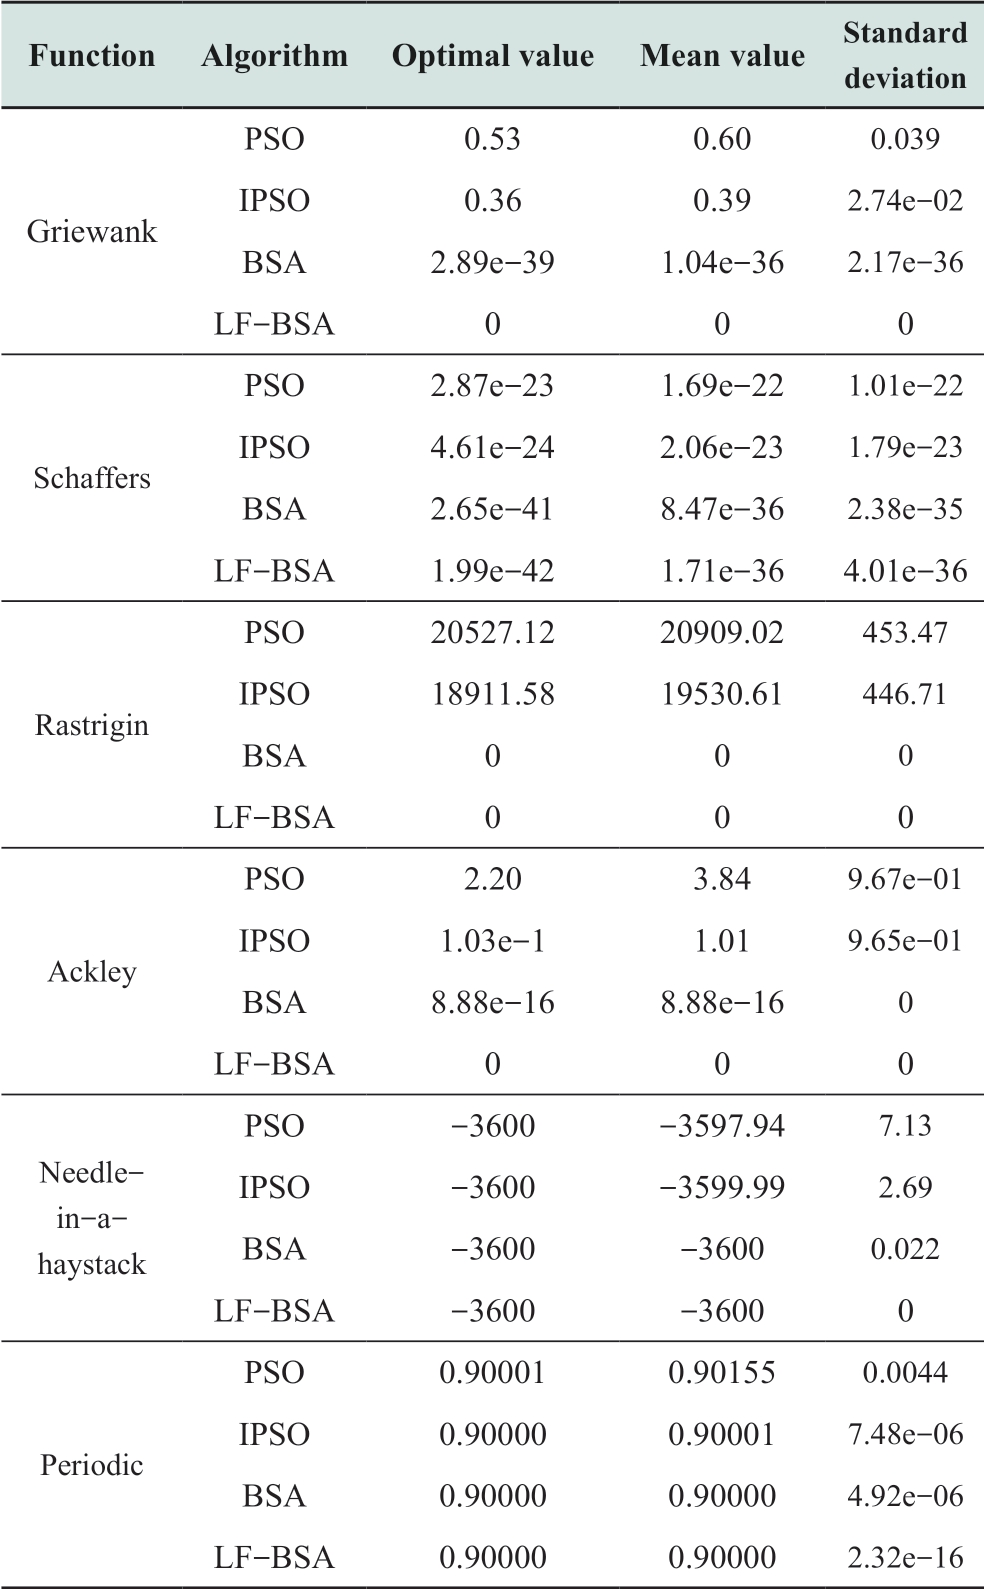
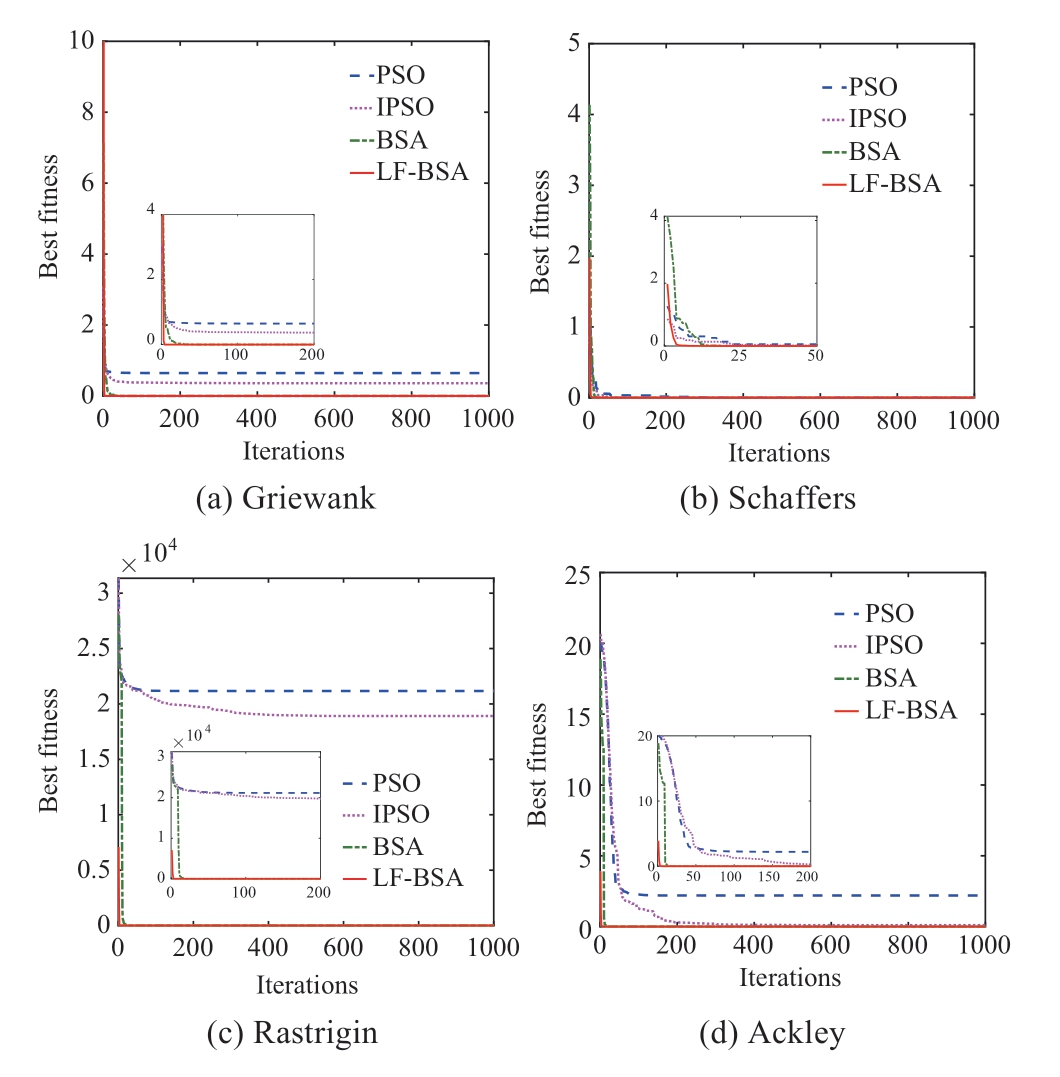
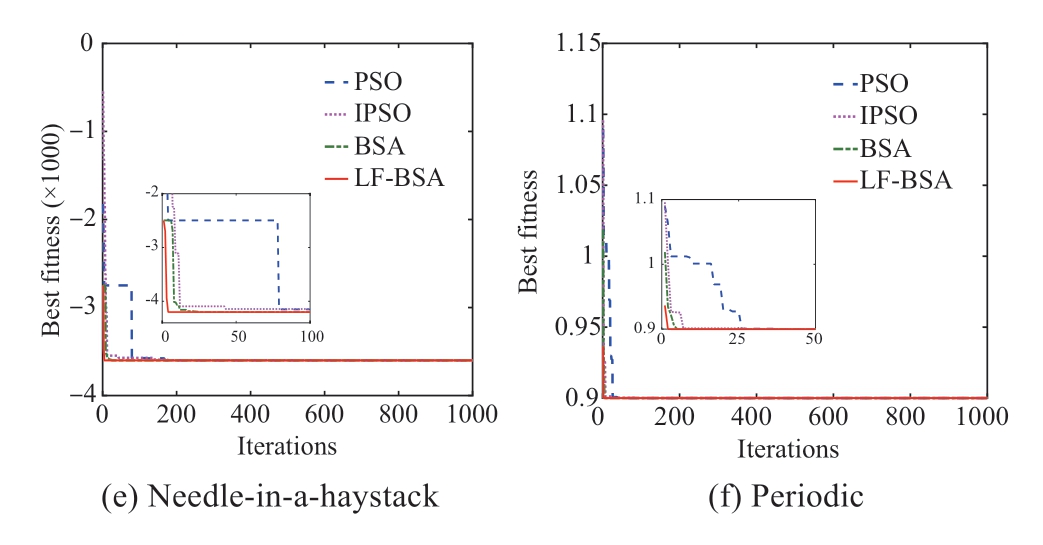
Fig.5 Convergence curves of PSO, IPSO, BSA and LF-BSA
From Table 2, it can be concluded that when solving the test functions listed in Table A1 in Appendix A, the mean values and standard deviations of the LF-BSA are smaller than or equal to those of the other algorithms.Moreover,with PSO and IPSO, the solutions fall into a local optimum for some optimization problems such as the Griewank,Rastrigin, and Ackley functions, because their optimal values are greater than the theoretical optimal values.The BSA solution also falls into a local optimum when optimizing the Ackley function, because both the optimal and mean values are 8.88e-16.In summary, the above results suggest that the convergence accuracy and stability of the LF-BSA are superior to those of the other three algorithms.
From Fig.5, it is noticeable that in the optimization processes of the six test functions, the convergence performance of the PSO algorithm is the worst, followed by that of the IPSO.In addition, the PSO solution falls into a local optimum when dealing with the Griewank,Rastrigin, and Ackley functions.Moreover, compared to the other algorithms, the LF-BSA achieves significantly improved convergence speed and accuracy, and it reaches convergence in a few iterations, which shows that the LF-BSA has a better computational efficiency than the comparison algorithms.
In conclusion, the global optimization performance, convergence accuracy, stability, and convergence speed of the LF-BSA are better than those of the BSA, PSO, and IPSO,which verifies its superiority to them.
4 A case study
In this research, a case study is conducted using a microgrid model in a certain area in China illustrated in Fig.1.A typical summer-time daily energy scenario is applied in the study, and the utility electricity purchase and sale prices [14], basic data of the DERs, and pollutant emission coefficients are listed in Tables 3-5, respectively.
Table 3 Utility electricity purchase and sale prices
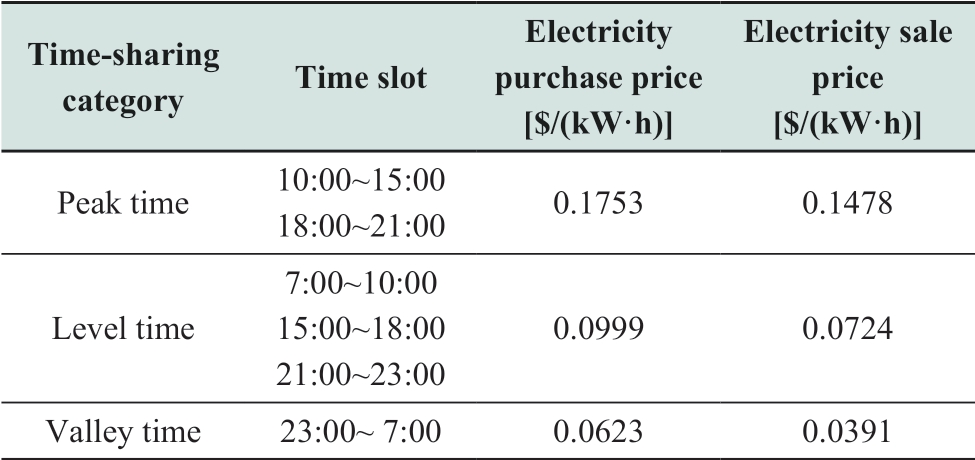
Table 4 Basic data of the DERs
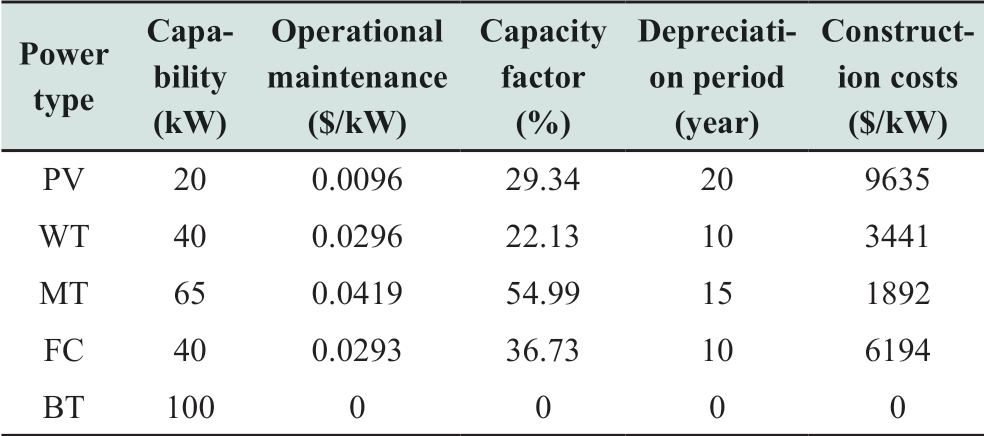
Table 5 Pollutant emission coefficients

The LF-BSA as proposed in Section 3 is programmed in C code using MATLAB.The LF-BSA updates the microgrid dispatching solutions over a 24-h period (T = 24 h)with 1-h interval.The system variables (multi-energy output power) are defined to be n × 24-dimensional to decouple the period (n is the number of schedulable units);therefore, the microgrid optimization problem in this study is 24-dimensional.The power point profiles of the WT,the PV and the MT as well as the cold and electric loads obtained using the forecasted data are shown in Fig.6.The WT and PV output power are calculated from the uncertainty prediction data of the temperature, light intensity, and wind speed (to highlight the focus of the LF-BSA to solve the microgrid scheduling problems, the uncertain calculation process of the source load is simplified).Concurrently, the MT follows the cold load, and consequently, its power output is defined by the forecasted cold load profile, as shown in Fig.6.Moreover, the BT is controlled to balance the DER power fluctuation, with the initial charge state set as SOC(0) = 0.5 under constraints SOCmin = 0.2 and SOCmax = 0.9.
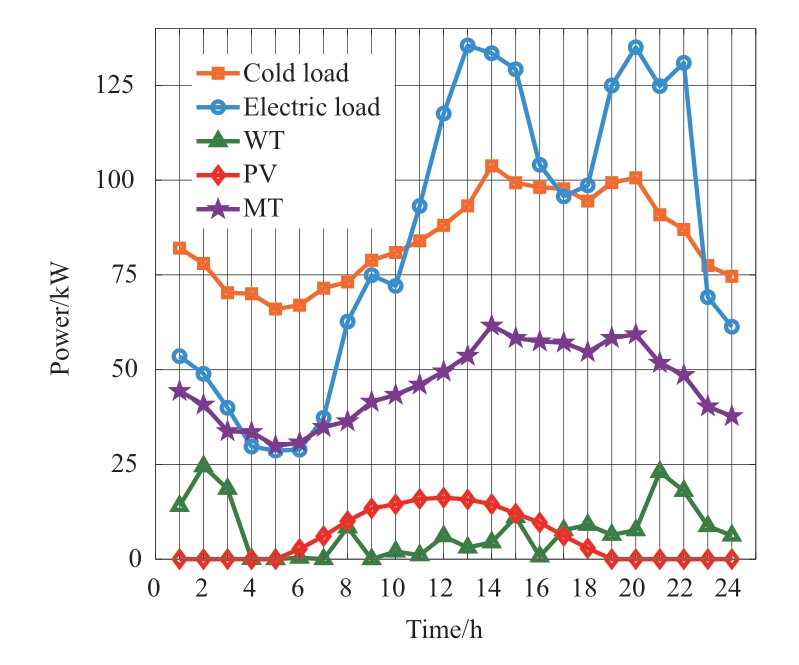
Fig.6 Cold & electric load and inflexible DER power points of the WT, the PV & MT in 24 hours
For the entire microgrid, the LF-BSA aims to flexibly dispatch the FC, BT, and utility grid for fulfilling the optimization functions as well as achieving cost minimization.
4.1 Microgrid dispatching under three objective functions
The microgrid under grid-connected operation is operated under the objective functions of three modes—Econ., Env., and Comb.modes—as expressed in (1), (2),and (5), respectively.For the Comb.mode, taking a group of weight coefficient as an example, the microgrid dispatching results are analyzed.It is assumed that the level of economic importance is “slightly” higher than that of environmental friendliness; therefore, by calculations using the dualistic factor contrast method, the weight coefficients are selected as  = 0.575 and
  = 0.425.
The optimization simulation results for the FC, BT, and utility grid are shown in Figs.7-9, respectively.Combining(1), (2), and (5), Tables 3-5, and Figs.7-9, the following conclusions can be drawn.
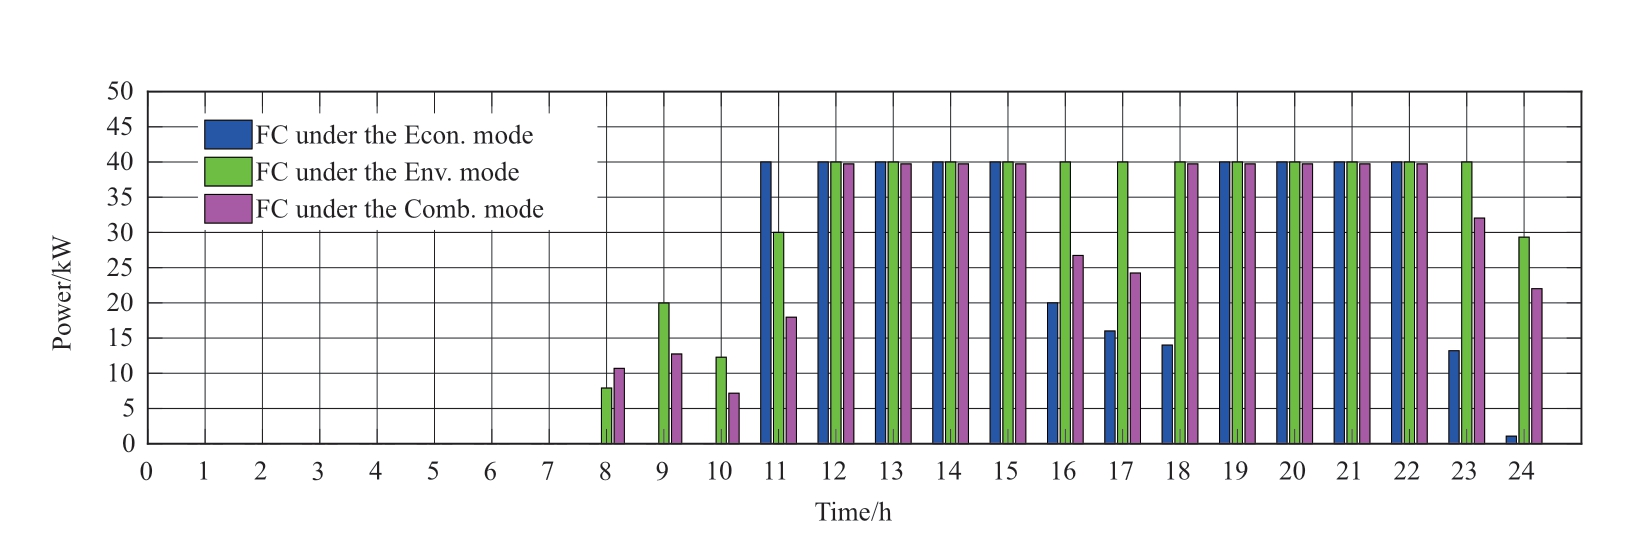
Fig.7 FC output diagram under different objective functions

Fig.8 BT output diagram under different objective functions

Fig.9 Grid output diagram under different objective functions
In the power valley time of 24:00-7:00 (+1 day), the demand is lower than the total inflexible power outputs of the WT, PV, and MT.The LF-BSA scheme charges the excess power first to the BT and subsequently to the utility grid.However, in another power valley time of 23:00-24:00, the electrical demand increases.In the Econ.mode,the power required by the loads is mainly supplied by the utility grid because of the relatively low purchase price.In the Env.mode, the FC with a low pollution gas penalty cost dominates the output.In the Comb.mode, the utility grid price is lower but the pollution cost is higher than those of the FC; therefore, the utility grid and the FC coordinately provide the output.
In the power level times of 7:00-10:00, 15:00-18:00,and 21:00-23:00, the electrical demand increases.As shown in the blue bar charts in Figs.7-9, the BT is generally charged or remains unchanged during these times.The Econ.mode of the LF-BSA scheme imports the power from the utility grid and the FC in sequence from lower to higher costs.In contrast, in the Env.mode, as the FC has a lower environmental cost than the utility grid, the FC is employed the most for power supply, and the system purchases electricity from the utility grid when the load demand is unsatisfied.In the Comb.mode, as the price and pollution penalization of the utility grid are lower and higher than those of the FC respectively, the FC and the utility grid coordinately provide the output.
In the peak times of 10:00-15:00 and 18:00-21:00, the utility electricity price is the highest.In the Econ.mode, as the FC has a lower power generation cost than the BT, first the FC is dispatched to generate power and subsequently the BT, and power import from the utility grid is lastly used to meet the remainder demand.Moreover, in the Env.mode,the system utilizes the BT power output the most owing to its pollution-free advantage, and subsequently the FC and the grid electricity import are sequentially dispatched.In the Comb.mode, the FC and the BT coordinately provide the output, and when the load demand is not met, the electricity is purchased from the utility grid.In the three modes, if the DER generation is excessive at any time, the scheme also sells the excessive electricity to the grid.
4.2 Cost analysis for microgrid dispatching
The microgrid dispatching costs in (1), (2), and (5) in the three modes are determined from simulations considering the cost references listed in Tables 3-5.Moreover, the obtained Pareto front curves (the economic-environmental cost curves under multiple groups of weight coefficients based on the LF-BSA) are shown in Fig.10, where = 1 and 0 correspond to the Econ.and Env.modes.Concurrently, to verify the advantages of the LF-BSA in the microgrid optimal dispatching problem, the BSA is used as a comparison algorithm, and simulation experiments are conducted in the same environment.The comparison results are summarized in Table 6.
It can be seen form Fig.10 that with the increase in w'1,the economic importance is higher than the environmental factor, which decreases the economic cost and increases the environmental cost.Concurrently, from calculations,the economic cost of the Env.mode 2.65% higher than that of the Econ.mode, whereas the environmental cost of the Econ.mode is 9.98% poorer than that of the Env.mode.The economic and environmental costs of the Comb.mode is between those of the Econ.and Env.modes, which suggests realizing the optimal tradeoff between the performance of the Econ.and Env.modes to accommodate both economic and environmental factors.
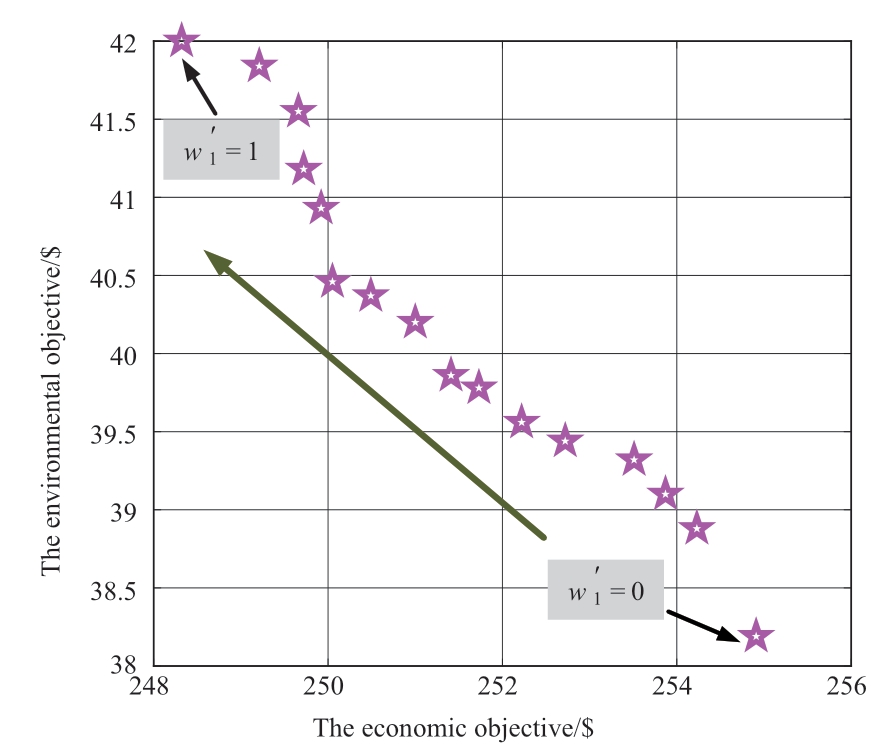
Fig.10 The Pareto front curve of the case study
From Table 6, in the dispatching results, the economic and environmental costs obtained by the BSA are 0.46%and 8.36% higher than those by the LF-BSA, respectively.Moreover, the number of convergence iterations of the LFBSA is 12.53% lower than that of the BSA, which shows occurrence of premature convergence with the BSA and effective convergence with the LF-BSA in a relatively shorter time.This also shows that the LF-BSA can effectively solve the microgrid dispatching problem.
Table 6 Comparison results of the BSA and LF-BSA algorithms

The above reasonable Pareto front curves and the comparison results of different algorithms show the effectiveness and optimality of the scheduling results.
In addition, to assess the overall advantage of the microgrid dispatching, the Comb.mode is taken as an example.The fuel costs, operational and maintenance (Ops.and maint.) costs, depreciation costs, and energy transaction cost with the utility grid as expressed in (1), (2), and (5)are considered.Based on them, the scheduling cost in each dispatch interval is simulated and calculated, and the results are shown in Fig.11.The simulation results show that the fuel and environmental cost account for 85% total cost, which should be addressed first for ensuring energy efficiency.Moreover, to improve the economy and environmental friendliness, it is important to implement fuel free and lowcarbon renewable power generation and energy storage in efficiency optimization for future microgrid applications.
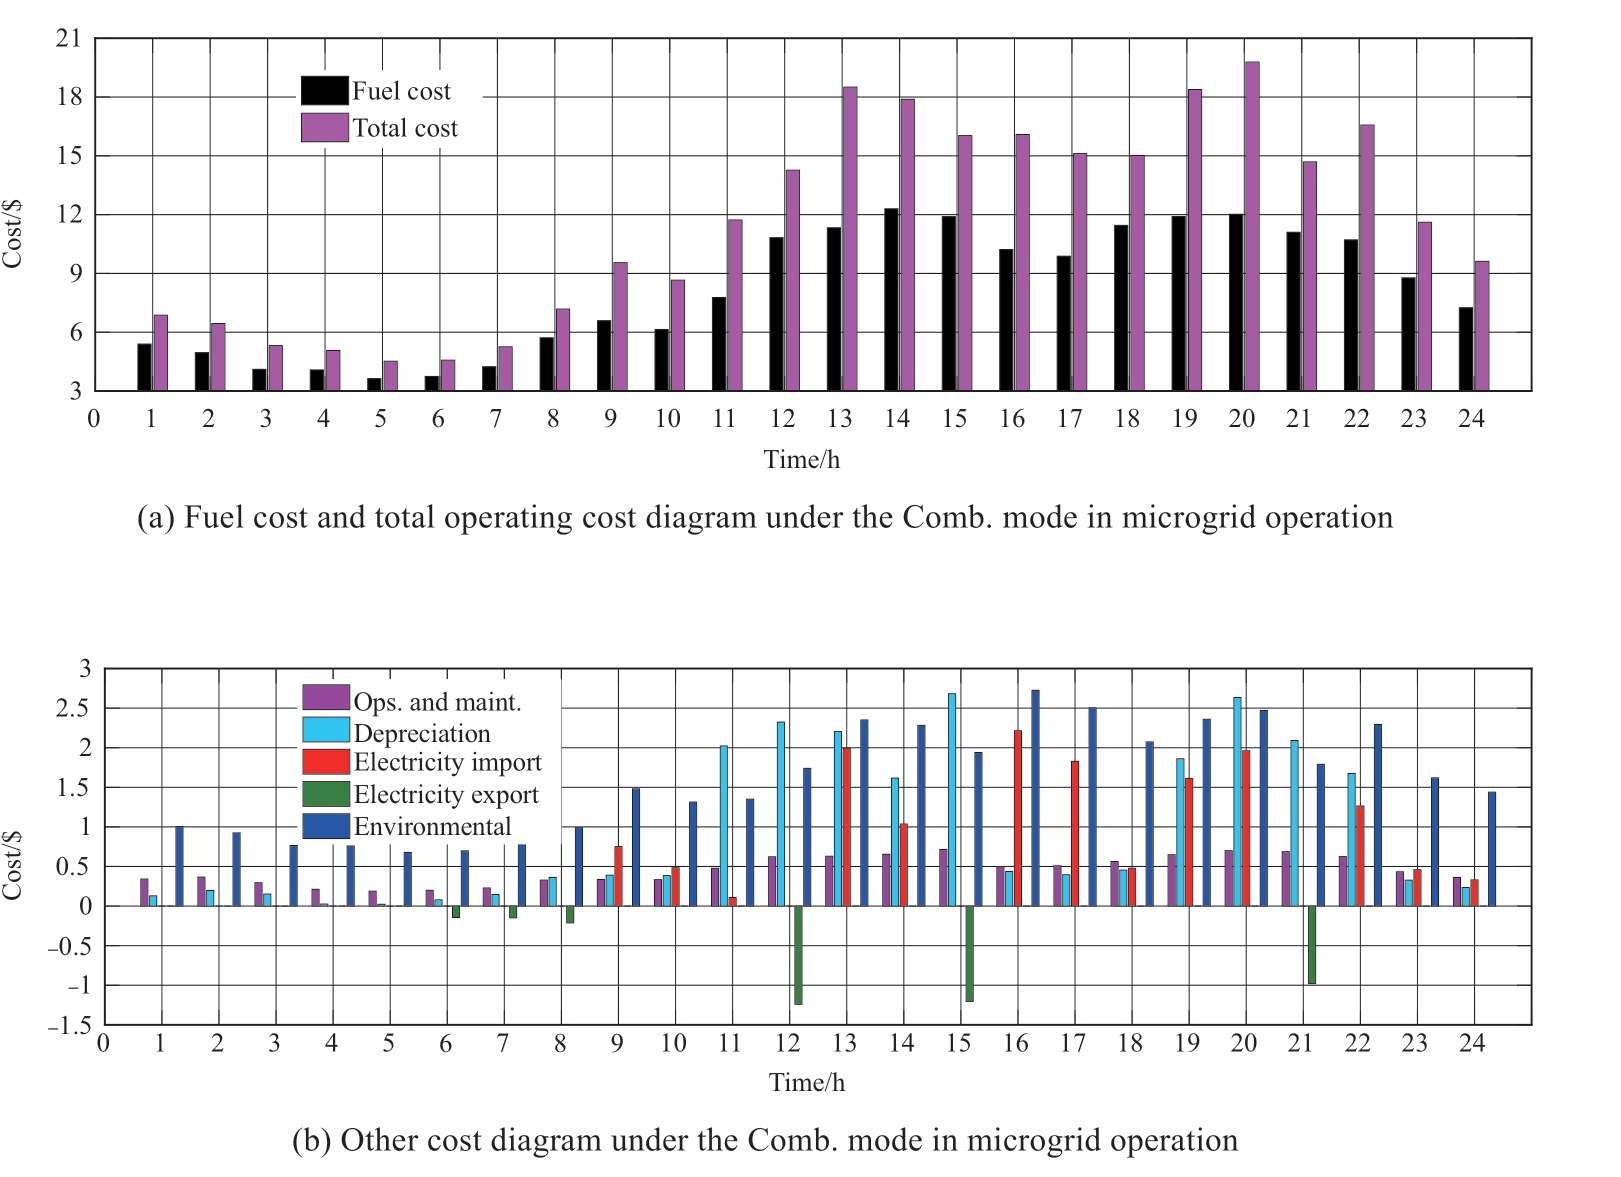
Fig.11 Cost diagram at each time of grid-connected operation under the Comb.mode
5 Conclusion
In this paper, a self-adaptive LF-BSA scheme with better convergence accuracy, stability and speed for microgrid dispatch is proposed.The LF-BSA employs adaptive inertia weights and time-varying learning coefficients and implements the LF strategy in the BSA to improve the global and local search performance and expand the search space.Six test functions including highand low-dimensional functions are used to compare the optimization performance of the LF-BSA with those of three well-recognized algorithms, and the results verify the superiority of the LF-BSA to the other methods.
A case study on an existing microgrid in a real energy scenario is conducted, and the following conclusions are obtained: 1) The proposed LF-BSA is feasible and effective for microgrid dispatching with multi-objective optimization.2) Multi-objective optimal dispatching implies the optimal tradeoff between the performance of the economy and environment and reasonable distribution of the DERs.3) The fuel and environment costs account for the largest part of the entire dispatch cost.To improve the economy and environmental friendliness, it is particularly suitable for a microgrid to be equipped with high proportions of renewable energy generation and energy storage.In addition, the findings shows that the LF-BSA can provide a new solution for the power system optimization problem.
Acknowledgements
This work was supported by the National Natural Science Foundation of China (No.52061635103).
Declaration of Competing Interest
We declare that we have no conflict of interest.
Appendix A
Table A1 Typical test functions [9, 28]
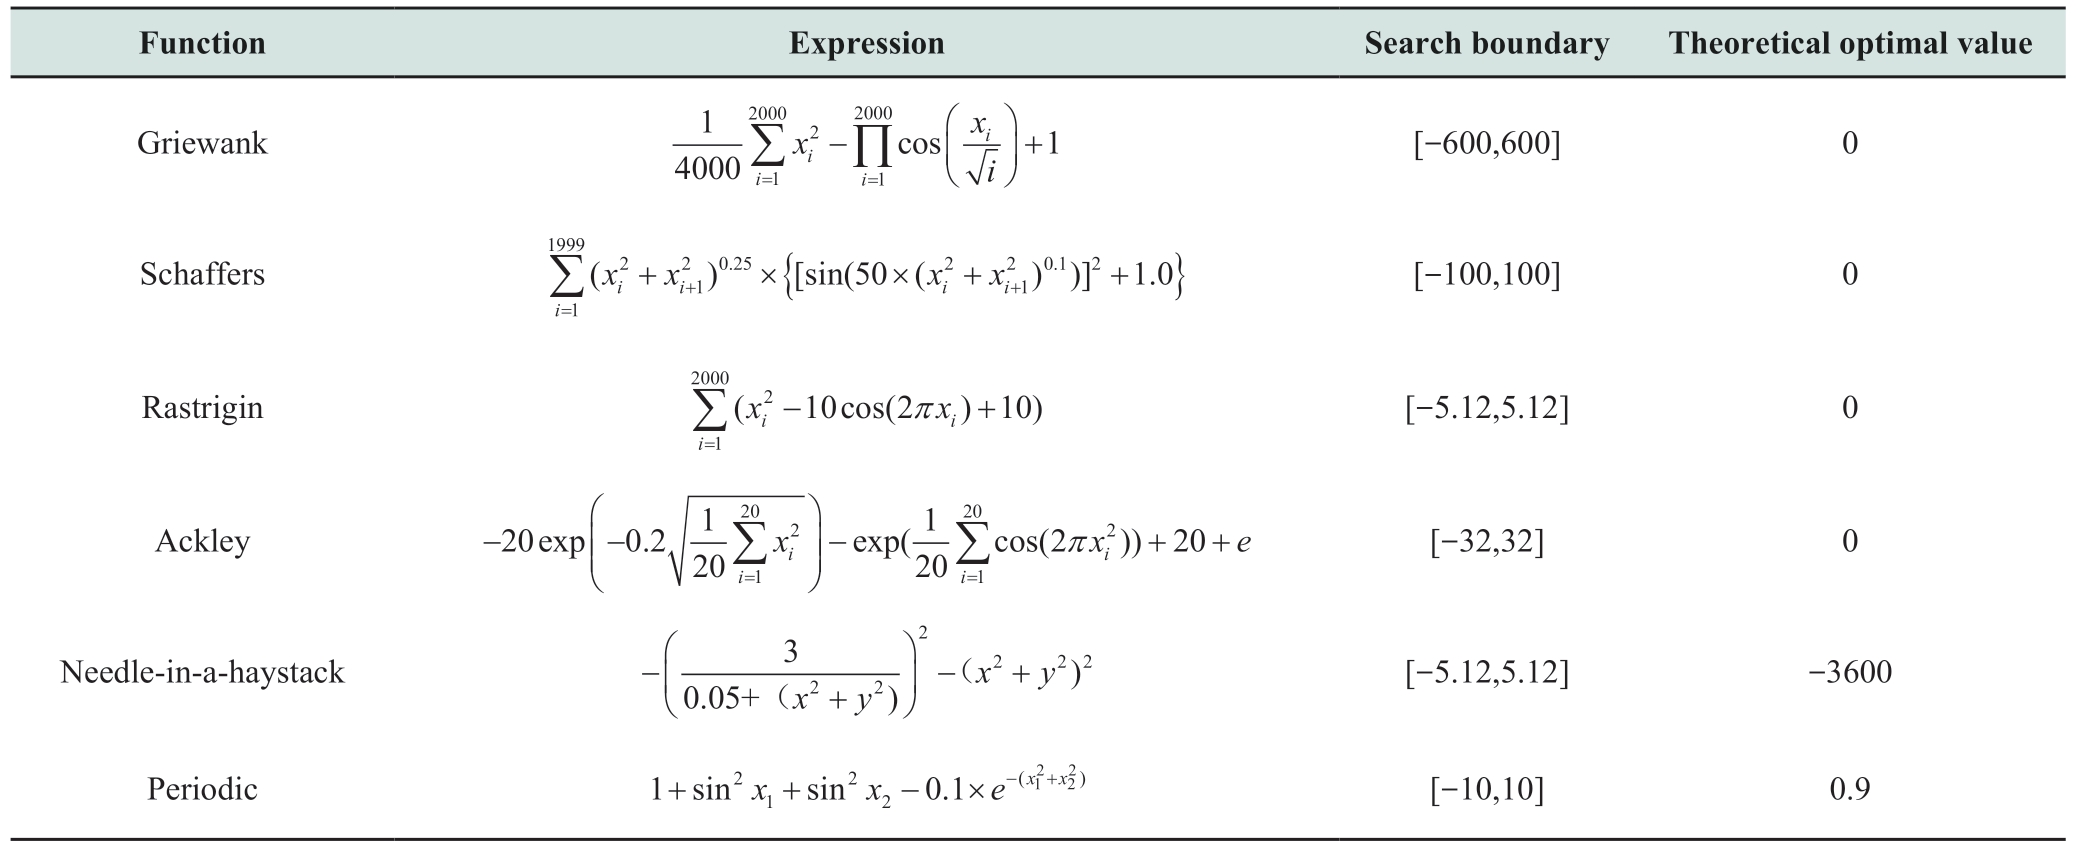
Table A2 The parameter values of the four algorithms

References
[1] Fallahi F, Yildirim M, Lin J, et al.(2021) Predictive multimicrogrid generation maintenance: formulation and impact on operations & resilience.IEEE Trans Power Syst, 3066462
[2] Fontenot H, Dong B (2019) Modeling and control of buildingintegrated microgrids for optimal energy management-A review.Appl Energy, 254: 113689
[3] Chen B, Wang J H, Lu X N, et al.(2021) Networked microgrids for Grid resilience, robustness, and efficiency: a review.IEEE Trans Smart Grid, 12(1): 18-32
[4] Khan A A, Naeem M, Iqbal M, et al.(2016) A compendium of optimization objectives, constraints, tools and algorithms for energy management in microgrids.Renew Sust Energ Rev, 58:1664-1683
[5] Li Z, Xu Y (2018) Optimal coordinated energy dispatch of a multi-energy microgrid in grid-connected and islanded modes.Appl Energy, 210: 974-986
[6] Mahmoud T S, Ahmed B S, Hassan M Y (2019) The role of intelligent generation control algorithms in optimizing battery energy storage systems size in microgrids: A case study from Western Australia.Energy Conv Manag, 196: 1335-1352
[7] Zhao X G, Zhang Z Q, Xie Y M, et al.(2020) Economicenvironmental dispatch of microgrid based on improved quantum particle swarm optimization.Energy, 195: 117014
[8] Yousif M, Ai Q, Gao Y, et al.(2020) An optimal dispatch strategy for distributed microgrids using PSO.CSEE J.Power Energy Syst, 6(3): 724-734
[9] Meng X B, Gao X Z, Lu L H, et al.(2016) A new bio-inspired optimisation algorithm: Bird swarm algorithm.J.Exp Theor Artif Intell, 28(4): 673-687
[10] Xin B, Chen J, Zhang J, et al.(2012) Hybridizing differential evolution and particle swarm optimization to design powerful optimizers: a review and taxonomy.IEEE Trans on Systems Man and Cybernetics, 42 (5): 744-767
[11] Loyarte A S, Clementi L A, Vega J R (2016) A multi-objective optimization strategy for the economic dispatch in a microgrid.IEEE PES Transmission & Distribution Conference and Exposition-Latin America, Morelia, Mexico, Jan 2016
[12] Yang Y, Lei X, Xu G Y, et al.(2014) Multi-objective optimal dispatch of microgrid using particle swarm optimization combined with bacterial foraging algorithm.Power System Protection and Control, (13): 13-20
[13] Moradi M H, Eskandari M, Mahdi H S (2015) Operational strategy optimization in an optimal sized smart microgrid.IEEE Trans Smart Grid, 6(3): 1087-1095
[14] Wang X Q, Lv Z L, Tang Z Q (2017) Multi-objective dynamic optimal dispatching of grid-connected microgrid based on TOU power price mechanism.Power System Protection and Control,45(4): 9-18
[15] Zeng C, Peng C H, Wang K, et al.(2016) Multi-objective operation optimization of micro grid based on bird swarm algorithm.Power system protection and control, 44(13): 117-122
[16] Wen D, Jin B (2016) Application of the bird swarm algorithmprojection pursuit regression model to prediction of multivariate annual runoff.Paper river, 37(11): 26-30
[17] Chechkin A V, Metzler R, Klafter J, et al.(2008) Introduction to the theory of Levy flights.Anomalous Transport, 129-162
[18] Ahmed J, Salam Z (2014) A maximum power point tracking(MPPT) for PV system using Cuckoo search with partial shading capability.Appl Energy, 119: 118130
[19] Hakl H, Uguz H (2014) A novel particle swarm optimization algorithm with Levy flight.Appl Soft Comput, 23: 333-345
[20] Wu X, Qi S, Wang Z, Duan C, et al.(2019) Optimal scheduling for microgrids with hydrogen fueling stations considering uncertainty using name="ref21" style="font-size: 1em; text-align: justify; text-indent: 2em; line-height: 1.8em; margin: 0.5em 0em;">[21] Marzal S, Salas R, González-Medina R, et al.(2018) Current challenges and future trends in the field of communication architectures for microgrids.Renew Sust Energ Rev, 82: 3610-3622
[22] Gungor V C, Sahin D, Kocak T (2011) Smart grid technologies:Communication technologies and standards.IEEE Trans Ind Inform, 7(4): 529-539
[23] Nikmehr N, Najafi R S (2015) Optimal power dispatch of multimicrogrids at future smart distribution grids.IEEE Trans Smart Grid, 6(4): 1648-1657
[24] Wu H B, Liu X Y, Ding M (2014) Dynamic economic dispatch of a microgrid: Mathematical models and solution algorithm.Int J Electr Power Energy Syst, 63: 336-346
[25] Zhong Y F, Huang M X, Ye C J (2014) Multi-objective optimization of microgrid operation based on dynamic dispatch of battery energy storage system.Electric Power Automation Equipmentx, 34(6): 114-121
[26] Liu J S, He J J, Li P F (2017) Improved particle swarm algorithm based on theory of complex adaptive system.Computer Engineering and Application, 53(5): 57-63
[27] Li M, Chen H, Shi X, et al.(2019) A multi-information fusion“triple variables with iteration” inertia weight PSO algorithm and its application.Appl Soft Comput, 84: 105677
[28] Yang X S (2014) Nature-inspired optimization algorithms.Elsevier
Received: 16 November 2021/ Accepted: 12 March 2022/ Published: 25 April 2022
Xiaoyan Ma
maxiaoyan@tju.edu.cn
Yunfei Mu
yunfeimu@tju.edu.cn
Yu Zhang
zhangyu@geidco.org
Chenxi Zang
17800489223@139.com
Shurong Li
18663794279@163.com
Xinyang Jiang
jiangxy@tju.edu.cn
Meng Cui
cuim_77@163.com
2096-5117/© 2022 Global Energy Interconnection Development and Cooperation Organization.Production and hosting by Elsevier B.V.on behalf of KeAi Communications Co., Ltd.This is an open access article under the CC BY-NC-ND license (http: //creativecommons.org/licenses/by-nc-nd/4.0/ ).
Biographies

Xiaoyan Ma received her master degree from Hebei University of Technology, Tianjin,China.She is currently working towards the Ph.D.degree at Tianjin University, Tianjin,China.Her research interests include the optimal operation of microgrid, the integration of 5G base stations and power grids, et al.

Yunfei Mu received his bachelor, master and Ph.D.degrees from Tianjin University, Tianjin,China, in 2007, 2009, and 2012, respectively.He is currently a Professor of electrical engineering in the School of Electrical and Information Engineering, Tianjin University.From 2010 to 2011, he was a Research Assistant with the school of Engineering,Cardiff University, Cardiff, U.K.His research interests include power system stability analysis and control, demand response, integrated energy system and the optimal operation of microgrid, et al.

Yu Zhang received his bachelor degree in North China Electric Power University and Ph.D.in Tsinghua University.He is working in Global Energy Interconnection Development and Cooperation Organization.His research interests include the optimal operation of microgrid, renewable energy, et al.

Chenxi Zang is currently working towards the bachelor degree at Xiamen University,Xiamen, China.His research interests include automation technology, renewable energy, et al.

Shurong Li received his bachelor and master degrees from Shandong University, Jinan,China, in 2011 and 2019, respectively.He is currently working in the China State Grid,Xiongan New Area Electric Power Supply Company, Hebei, P.R.China.His research interests include the optimal operation of microgrid.

Xinyang Jiang is about to pursue the master degree at Tianjin University, Tianjin, China,in 2022.His research interests include the integration of 5G base stations and power grids and the base station backup energy storage.

Meng Cui received her bachelor degree from the China Three Gorges University,Yichang, China, in 2018.She is currently an administrator at the electric power dispatching and control center of the State Grid Baoding Electric Power Supply Company.Her research interests include the automatic operation of smart grid, et al.
(Editor Yajun Zou)
