0 Introduction
In the current rapidly developing economy, cars have become an integral part of everyday life.Conversely,environmental pollution due to vehicle emissions is increasingly becoming serious, and it is has led to enormous pressure on our natural environment.Furthermore, as the number of vehicles continues to increase, the demand for energy is also growing.Electric vehicles offer significant advantages in terms of environmental protection and energy consumption.Hence, there is a need for a rapid rise in new clean energy sources for human health and living environment requirements [1-3].
The development of electric vehicles cannot be realized without advanced battery technology, and hence,realization of fast-charging of lithium-ion batteries has attracted significant attention.The charging strategy is crucial to ensure high-quality operation of the battery wherein charge control is one of the most important factors.It affects charging speed, efficiency, temperature rise,and even battery life [4-7].Current conventional charging methods include constant current charging, constant voltage charging, and segmented constant current and constant voltage charging [8-10].In extant studies [11], a modelfree reinforcement learning framework and fast charging strategy subject to safety constraints have been proposed.They overcome the limitations of model complexity and uncertainty and improve online adaptability to changes in environmental parameters.In a previous study [12], a hybrid charging strategy with adaptive current control (CCCC-CV) was proposed.This strategy reduces the increase in temperature of the battery by abruptly reducing the charging multiplier, a method that effectively reduces energy losses without compromising charging time and capacity.Furthermore, in a previous study [13], Taguchi’s method was used to search for the optimal charging mode for a 5th order constant current charging strategy.Furthermore, the effect on charging capacity and efficiency and time was analyzed.This in turn improved the charging efficiency and reduced increase in temperature of the battery when compared to conventional CCCV.In a previous study [14],temperature rise and energy loss were considered as the objective function, and an optimized multi-stage constant current charging method was used.Experiments were conducted at different ambient temperatures with different battery types and ageing states, and the designed charging strategy was able to realize the expected results at any ambient temperature and different ageing states.This can effectively improve charging efficiency and reduce energy loss and charging time.In a previous study [15], a Taguchibased particle swarm optimization algorithm was used to search for the best charging mode for four-stage constant current.The objective involved maximizing the cost function of the applied charging mode based on the ratio of charging time to discharging capacity, which are equally weighted.Hence, the method provides maximum capacity and longer running time for the shortest charging time.In a previous study [16], a particle swarm algorithm was used to optimize the PID parameters and use the optimized PID parameters for the control system of battery charging.This improved the charging efficiency and reduced the temperature rise of the battery.In an extant study [17], a polarization-based strategy for optimizing the charging time and temperature rise of Li-ion batteries was proposed.This in turn introduced an enhanced thermal behavior model to improve the accuracy of the charging current solution and used a genetic algorithm to solve for the optimal charging current.The method shortens the charging time with almost the same temperature rise.Furthermore, in a previous study [18], an adaptive charging strategy with temperature rise mitigation and extended cycle life was proposed.A temperature rise controller was designed to adjust the charging current according to the temperature gradient,and this method reduced the charging temperature rise and extended the cycle life of the battery when compared to conventional CCCV.In another study [19], an improved fifth-order constant current charging method was proposed based on Taguchi’s method by using an orthogonal array to determine the optimum fifth-order charging current value and two fuzzy controllers to eliminate polarization during charging.This in turn improves charging efficiency when compared to conventional fifth-order constant current charging.Additionally, in an extant study [20], charging time and temperature rise are considered as the objective function, and a suitable current profile is determined for constant current and constant voltage charging to minimize the dual objective function by means of the TLBO algorithm.Furthermore, the effect of different weights on the optimal charging profile is analyzed.The strategy can effectively balance the charging time and temperature rise in the process of flushing the whine.
The objective of this study involves reducing the battery charging time, and the temperature rise of the battery during charging is used as a constraint to establish the corresponding objective function and constraints.The objective function is solved via genetic algorithm, and the results obtained are used to optimize the multi-stage constant current charging method.To address the shortcomings of the traditional multi-stage constant-current charging segmentation method, in this study, we propose a secondary segmentation method combining fixed SOC segmentation and voltage segmentation to optimize the multi-stage constant-current charging current.Finally, the optimized charging strategy, proposed in this study, is experimentally verified under two common battery operating conditions.
1 Battery modelling
1.1 Thevenin model
The structure of the Thevenin model is shown in Fig.1.The Thevenin model is the most classical battery model [21].It can describe the open-circuit voltage, internal resistance,polarization capacitance, and polarization resistance of the battery.Furthermore, it reflects the temperature rise of the battery during the charging process and satisfies the research requirements of this study.
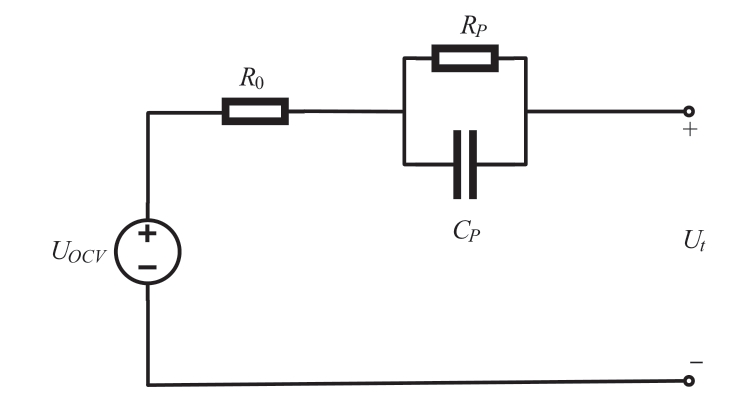
Fig.1 Thevenin equivalent circuit model
1.2 Battery charging temperature rise mod el
To model the power lithium charging temperature rise more accurately, the following premise assumptions should be made [22].
1.the temperature rise model treats the cell as a mass,the average specific heat capacity of the components of the cell is used as the specific heat capacity of the cell mass model, and the heat transfer coefficient and specific heat capacity of the cell are constants [23] and do not vary with SOC and temperature.
2.Uniform distribution of the chemical material inside the cell wherein the internal material density remains constant.
During the charging process, there are several main sources of heat inside the power cell [24].(1) The thermal power due to the entropic change in the chemical process during the charging of the battery.(2) The thermal power of polarization due to the phenomenon of polarization during the charging of the battery.(3) The joule heat power generated by the charging current flowing through the ohmic internal resistance.(4) The power of heat exchange between the battery and external environment.(5) Heat radiation resulting from the outward emission of radiant energy from an object due to the movement of microscopic particles within the object (or due to the object's own temperature) and heat transfer from a higher temperature part along the object to a lower temperature part during matter-to-matter contact.During the experimental process,the effect of thermal radiation is very small and the effect of battery thermal radiation can be ignored.Hence, internal temperature distribution of the battery as a whole can be set as uniform, and thus, no heat conduction can be regarded in the internal of the battery.In summary, the heating power of the battery can be expressed as equation (1) as follows:
where Q0 denotes the total battery heat generation power; QS denotes reversible thermal power; QP denotes the polarized thermal power, arising from the polarized internal resistance.Furthermore, QJ denotes the ohmic thermal power, arising from the ohmic internal resistance.Additionally, QN denotes the heat exchange power, reflecting the phenomenon of heat exchange between the battery and ambient temperature.The total cell heating power can be expressed as equation (2) as follows:
where T denotes the battery surface temperature; m denotes the battery quality; and Ch denotes the battery thermal capacity.
The reversible heating power QS of the battery can be expressed in equation (3) as follows:

where ΔS denotes entropy change; T denotes the battery surface temperature; E denotes the open-circuit voltage; n denotes the number of electronic reactions during charging;and F denotes the Faraday constant.
The polarization heating power Qp can be expressed as follows:
where i denotes the battery charging current.
The ohmic heating power QJ can be expressed as follows:
where i denotes the battery charging current; R0 denotes the ohm internal resistance.
The heat exchange power QN is expressed in equation (6)as follows:
where h denotes the heat transfer coefficient of the battery;A denotes the surface area of the battery; Tope denotes the ambient temperature of the battery charge.
By combining equations (2) to (6) with equation (1), we can obtain the following expression.
Given that the battery temperature varies continuously with time during charging, the battery temperature is set as a function of time to obtain equation (8).

Furthermore, equation (8) can be expressed as Equation(9).

The mathematical model of temperature rise developed in this study is expressed in equation (10).

1.3 Battery temperature rise model verification
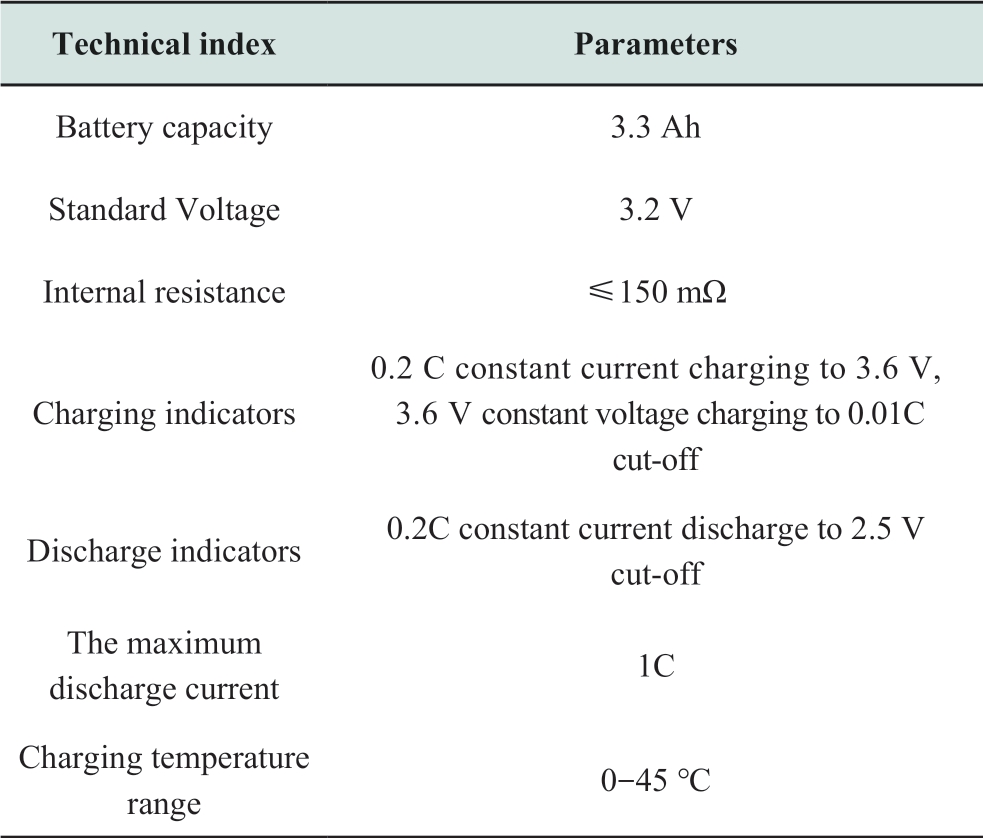
The model of the lithium-ion power battery used in this study is a 26650 LiFePO4 battery, and its specific parameters are listed in Table 1.
Table 1 Technical parameters of the battery
CC charging experiments were conducted on the battery,where C denotes the rated capacity of the battery, and the temperature change at the same location was recorded when the SOC reached 90%.Constant current charging experiments were conducted at 0.2C, 0.5C, 0.8C, and 1C, and the temperature rise plots for different charging multipliers and different initial SOCs are shown in Fig.2.The figure shows that the temperature of the battery varies with the charging current.Specifically, as the charging current increases, the temperature increases faster.
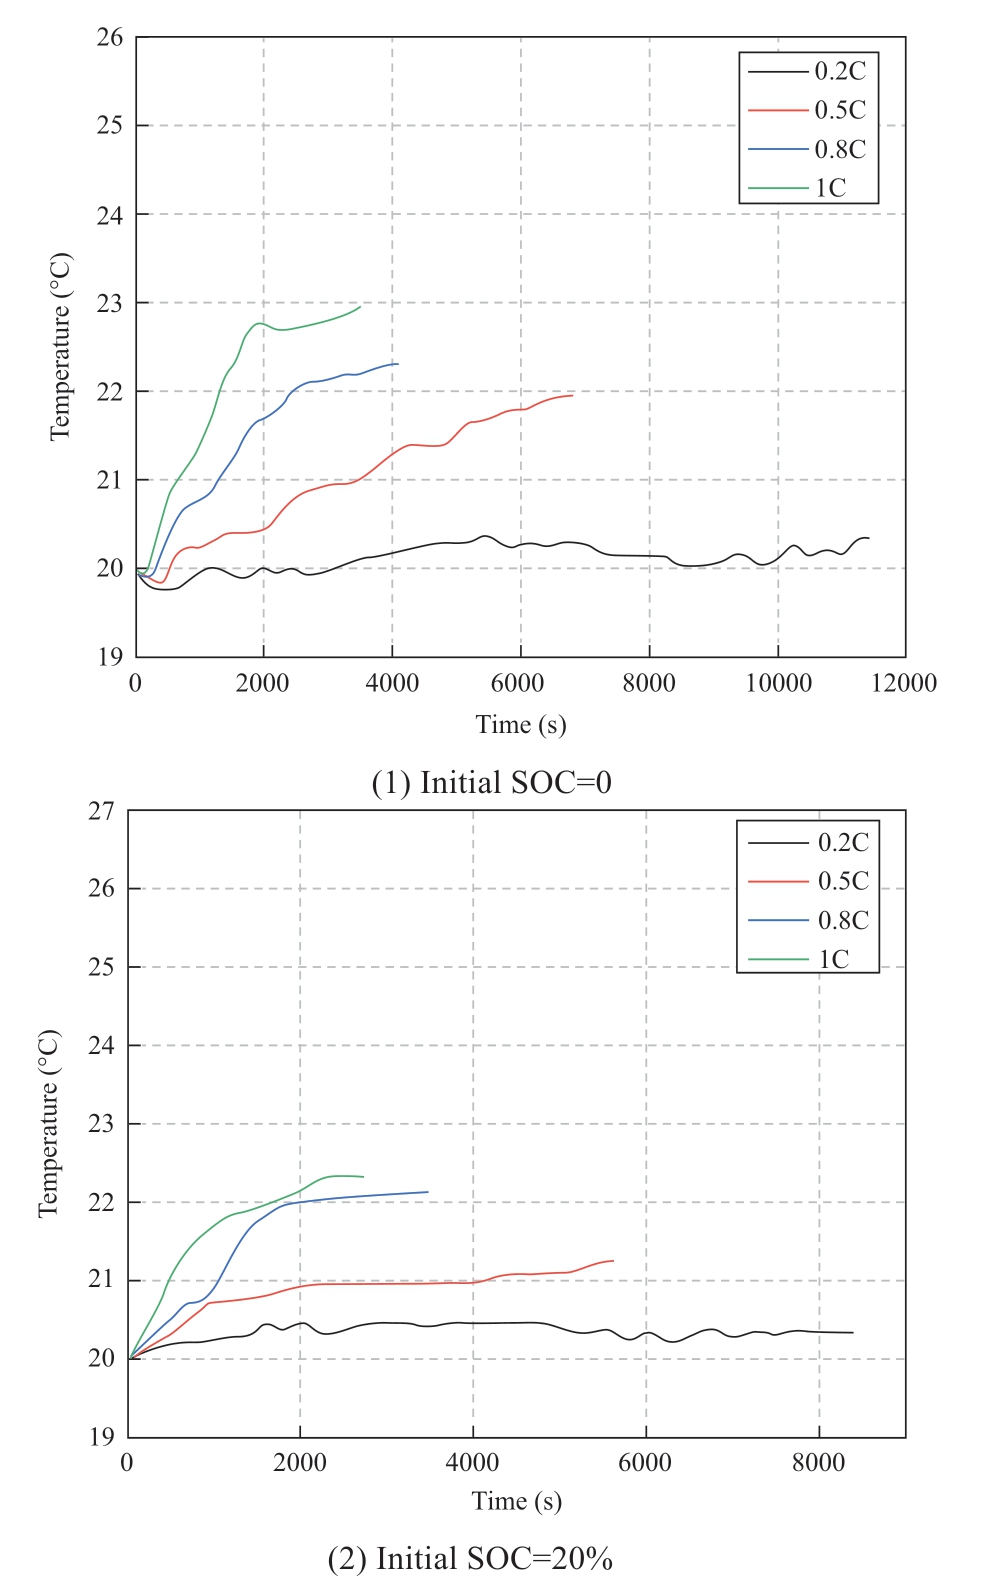
Fig.2 Different initial SOC temperature rise graphs
Firstly, set the temperature of the thermostat to 20 °C.Discharge the battery to the cut-off voltage with the standard discharge current specified in the battery manual.At this point, the battery can be considered as fully discharged, i.e.,SOC reaches 0.Then, charge the battery to 20% SOC, 40%SOC state with a constant current in line with the battery safety regulations.After the above three SOC states of the battery were placed in the thermostat for a sufficiently long period of time, the battery was continued to charge at constant current until it was charged to 90% SOC state.The temperature change in the battery was recorded in real time during the aforementioned charging process, and the difference between the temperature of the battery at the end of charging and temperature of the battery at the beginning of charging corresponded to the temperature rise during the charging process.The obtained experimental results are listed in Table 2.
Table 2 Validation results of 20 °C temperature rise model
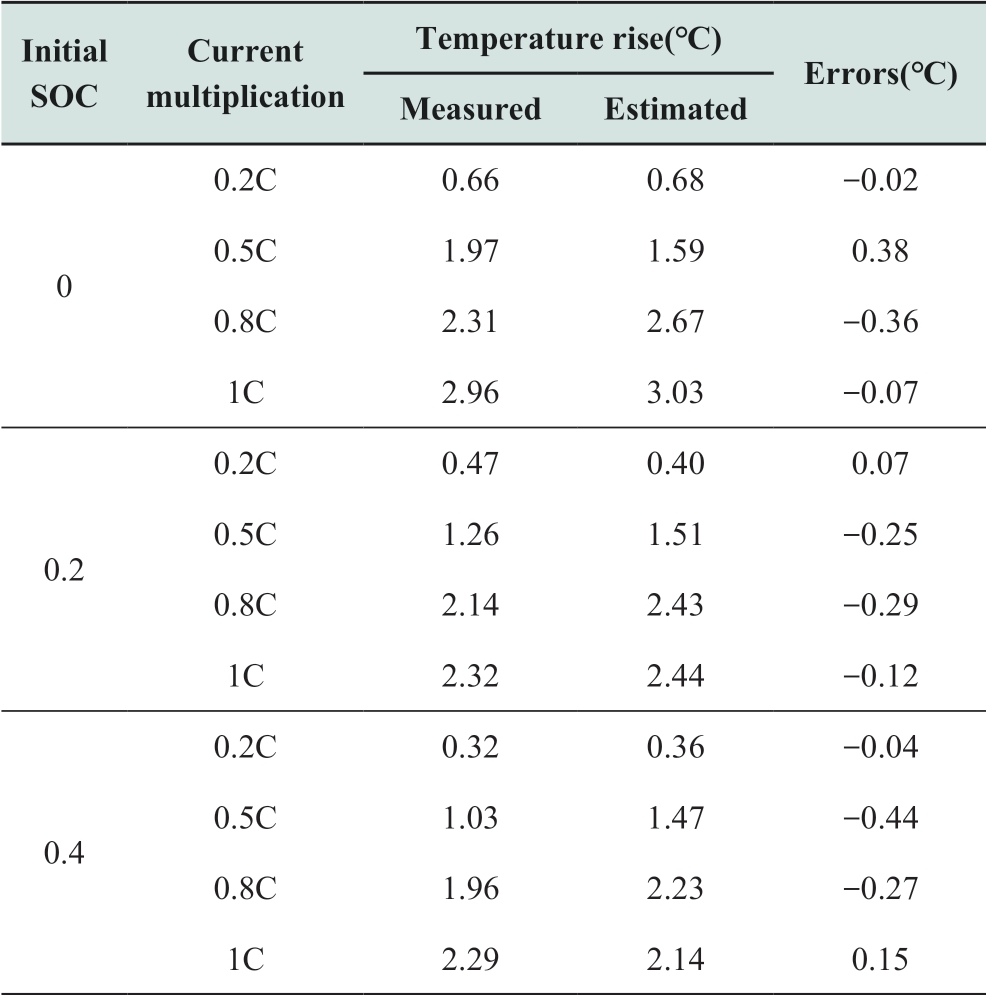
Based on the above experimental process, to determine the battery temperature rise, statistical data table can be obtained.Furthermore, the temperature rise value estimated by the model and experimentally obtained temperature rise value exhibit the same change trend as follows: under the same temperature condition, with the increase in the charging multiplier, the battery charging temperature rise shows an increasing trend, and this changes the trend in different initial SOC conditions.As the temperature increases, the battery charging temperature also increases,but its trend remains the same.It can be proved that the established battery temperature rise model and parameters of the model can accurately simulate the temperature rise of the battery, and the error of the model can be maintained below 0.7 ℃.This ensures sufficient accuracy, and most of the estimated values are often larger than the measured values.
2 Genetic algorithm-based multi-stage constant current charging strategy
A genetic algorithm is used to solve the objective function, and the solution flow chart is shown in Fig.3.Furthermore, the result of each stage is used as the optimal charging current for that stage.Additionally, the charging strategy in this study is implemented in the form of multistage constant current charging.Hence, the method of determining the number of charging stages should be examined.Finally, the charging curves at different temperatures are calculated according to the proposed optimal charging strategy, and a database of battery charging curves is formed.During actual charging, the battery is charged with a suitable charging curve according to the different operating conditions.
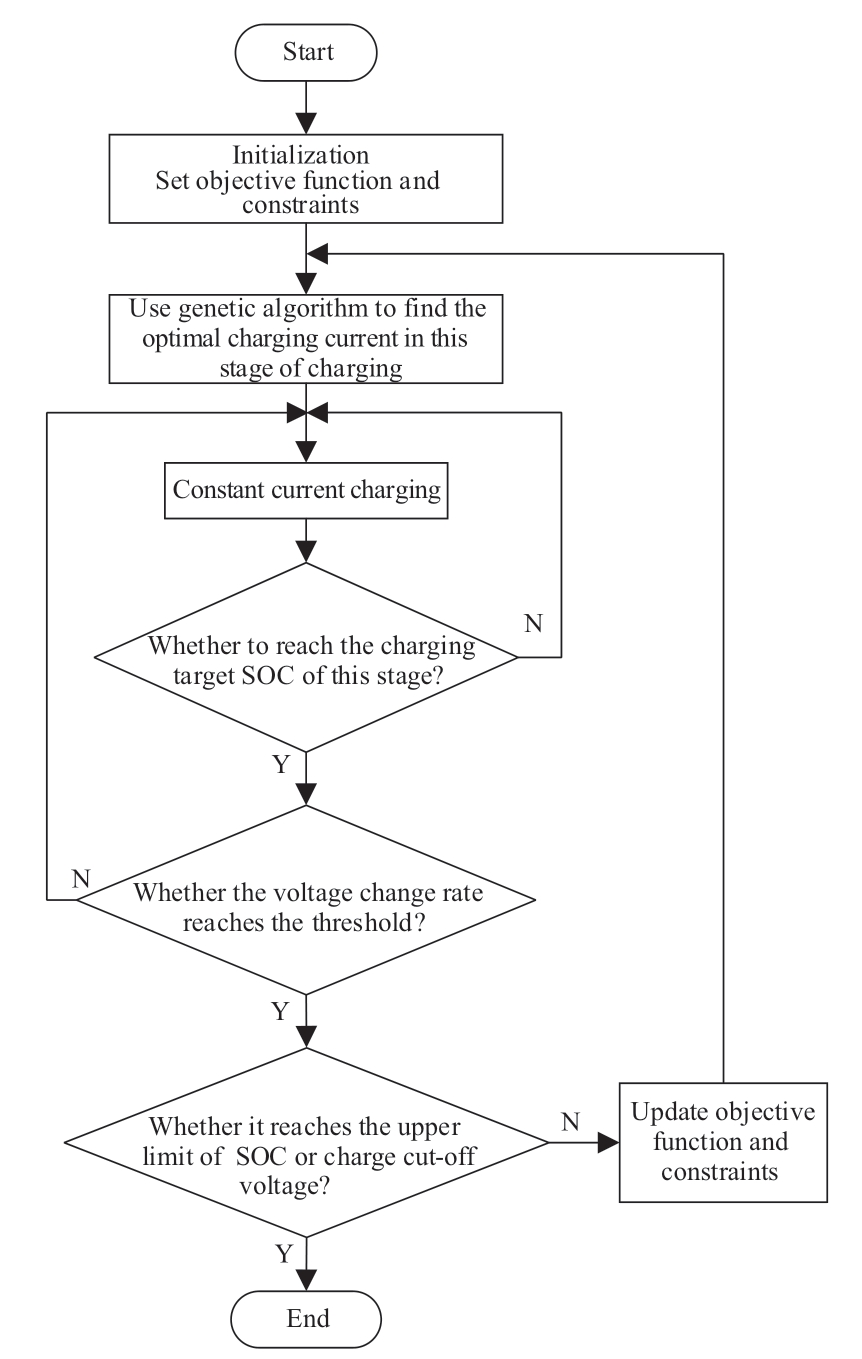
Fig.3 Flow chart of optimized charging strategy
2.1 Objective function construction
The research objective of this study involves optimizing the charging time for multi-stage constant current charging.Hence, the objective function, with minimum charging time as the goal, is established as follows:
Where k denotes the number of charging stages; ΔSOC denotes the difference between the SOC value of the battery at the end of this phase of charging and SOC value at the beginning of this phase; C is the battery capacity; i(k) is the charging current of the kth stage.
After determining the objective function with the minimum charging time as the optimization objective, it is necessary to consider the battery temperature rise constraint generated during the charging process.A constraint, as shown in equation (12), is proposed as follows:
Where ΔT denotes the temperature rise of the battery during charging; ΔTmax denotes the maximum battery temperature rise during charging.Given that the optimum operating temperature of Li-ion batteries is approximately 30 °C, the temperature rise of 1-C constant current charging at 30 °C is used as the maximum temperature rise in this study.
Considering the safety issues during battery charging,other inequality conditions should also be set to constrain the charging process during optimization.Given that the charging response at the beginning and end of battery charging is very different from when the remaining battery capacity is sufficient, the battery voltage variation trend varies significantly when the battery SOC is 10% or near 90% of the battery SOC, and considering the actual usage of electric vehicles, the charging process examined in this study has a lower limit of 10% for battery SOC and an upper limit of 90% for battery charging.According to the battery manual used in this study, the maximum charging current should not exceed 1C, and the minimum charging current should not be less than 0.2C.Additionally, the end voltage keeps increasing when the battery is charging.Hence, to avoid the phenomenon of overcharging, the charging cut-off voltage is set to 3.6 V based on the battery safety manual.In summary, the inequality constraint should be as follows:

After determining the objective function and constraints,a genetic algorithm is used to solve for the charging current at each stage.
2.2 Implementation of genetic algorithm
The functions of several major steps included in the genetic algorithm are [25].
(1) Initialization: Considering the possible local optimal solutions, the upper limit was set to 1000 generations; the initial population size was set to 20; the variation probability was 0.4; and the crossover probability was 0.7.
(2) Calculating the fitness function: The fitness function is obtained via linear transformation of the objective function.
(3) Selection, crossover, and variation
(4) Termination of condition judgement
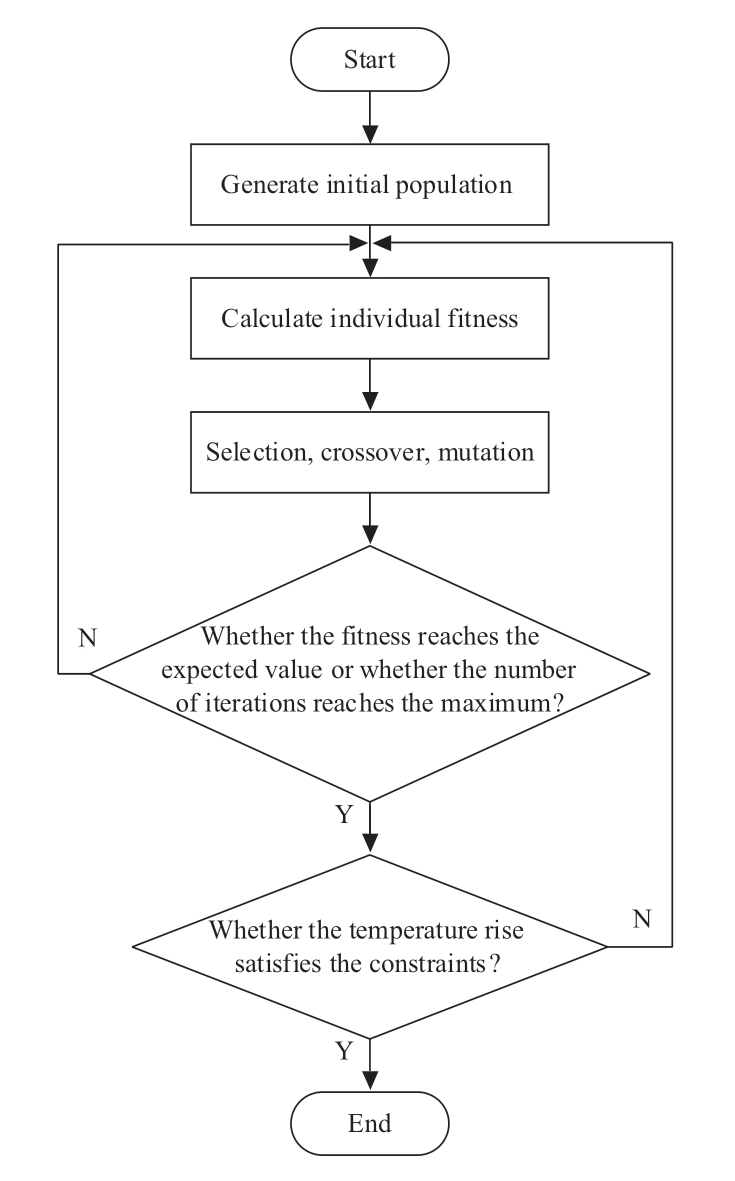
Fig.4 Genetic algorithm flow chart
2.3 Establishment of adaptation function
The fitness in genetic algorithms represents the adaptability of individuals to the set environment in the algorithm, and it is an indicator used to judge the degree of merit of individuals in the population.Hence, it is also termed as the evaluation function, which is usually evaluated in the algorithm based on the objective function set in advance [26].Furthermore, the setting of the fitness function directly affects the performance of the genetic algorithm.
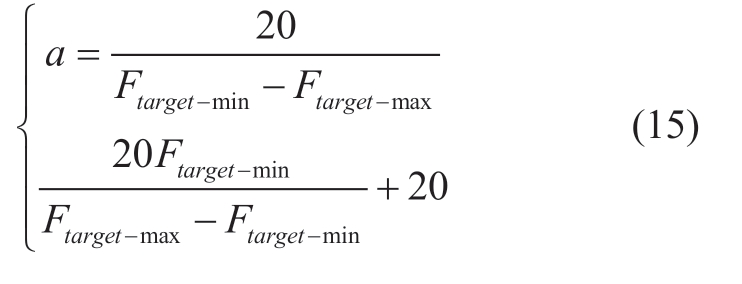
The objective function on charging time is established in this study, and in this section, the objective function is linearly solved as the fitness function in the algorithm with the linear variation formula in equation (14).
The fitness function considers values in the range [0,20],and a smaller target value in the range implies that the solution is better adapted to the environment in which the algorithm is set up.The parameters a and b in equation (14)are calculated as shown in equation (15).
2.4 Method for determining the charging order
The current multi-stage constant current charging method usually uses SOC or voltage as the cut-off condition for each stage of charging, and after the corresponding cut-off condition is reached, the charging moves to the next stage.Among the methods, the multi-stage charging method, using SOC as the charging cut-off condition, has the advantage of flexibly controlling the charging length of each stage in the charging process.However, this method is disadvantageous when the number of steps is too large.Specifically, it can generate a large amount of computation in the charging system, which requires high processor performance [27-28].The multi-stage charging method,which uses voltage as the charging cut-off condition,sets a threshold voltage for each stage and terminates the current stage when the battery terminal voltage reaches the threshold for the respective stage and moves to the next stage.The advantage of this method is that the voltage variable is easy to measure and has high accuracy, but the cut-off voltage is difficult to select and the segmentation criteria are difficult to determine.To compensate for the shortcomings of the two staging methods, in this study, a secondary staging method, which combines SOC staging and voltage staging, is proposed.The charging process is first staged with a fixed SOC interval, and at the end of each stage, the rate of change of the battery voltage with respect to the charging time is calculated for the respective stage.Furthermore, when this rate of change is below a certain threshold, the charging proceeds to the next stage.
The secondary segmentation method, proposed in this study, starts by segmenting the battery charging process with fixed SOC intervals.To investigate the effect of SOC interval length on the charging time, the charging intervals are segmented with 10% SOC and 20% SOC, and the simulation experiments are conducted separately.The results of the charging time obtained are listed in Table 3.
Table 3 Comparison of charging time effect of different segmentation methods

Table 3 shows that there is a significant decrease in charging time as the value of SOC considered per stage decreases, i.e.the number of charging stages increases.However, the increase in the number of stages represents an increase in the number of calculations, and each additional stage of charging results in a corresponding increase in the number of algorithm calculations.Furthermore, considering the question of whether the accuracy of the battery SOC estimation during charging is sufficient, every 10% SOC is selected as the segmentation basis for the first stage segmentation.
The charging process were approximately divided into three intervals of 10%-40% SOC, 40%-60% SOC,and 60%-90% SOC for the study, and the batteries were charged at a constant current of 0.4C, 0.6C, 0.8C, and 1C in each interval, respectively.Furthermore, the rate of change of their respective voltages with respect to the charging time was recorded.Finally, the results are obtained as listed in Table 4.
Table 4 Battery voltage variation rate with respect to time in each SOC interval at different charging current multipliers (10-5V/s)

After obtaining the data in Table 4, the value with the largest rate of change within each SOC interval segment is selected as the threshold for judging the transition of charging stages within the respective interval.Based on the first segmentation at each 10% SOC, a second stage of segmentation was conducted.When the rate of change of the battery terminal voltage following time within each 10%SOC interval during charging is less than this threshold, the next stage of charging is conducted.If the rate of change of the battery terminal voltage following time within each 10%SOC interval is greater than this threshold, then the charging continues at the present current.Simulation experiments with the secondary segmentation method, proposed in this study, are compared with the simulation results obtained using only SOC segmentation as listed in Table 5.
Table 5 Comparison of charging effects of different segmentation methods

Based on Table 5, it can be concluded that the secondary segmentation method proposed in this study is slightly shorter in terms of charging time when compared to the fixed SOC segmentation method.Hence, it is able to reduce the computational complexity of the charging system and improve the problem of the large number of operations in the fixed SOC segmentation method.
2.5 Charging current curve simulation results
The charging characteristics inside the battery vary at different ambient temperatures [29].Hence, the charging strategy should be investigated at different ambient temperatures to optimize the charging characteristics of the battery.Based on the optimal temperature range for power batteries, in this section, the optimal charging strategy proposed in this study is simulated at an ambient temperature between 10 °C and 50 °C.Furthermore, the charging current curve database, as listed in Table 6, is obtained.
Table 6 shows the charging current data for a 10% SOC stage at a temperature interval of 10 °C, where the battery is charged using constant current charging in each SOC interval.The table shows that when the battery SOC is at a low level and ambient temperature is not high, the battery is charged at a larger multiplier as the battery SOC level increases.Furthermore, as the ambient temperature rises, the charging current multiplier becomes progressively smaller.
3 Experimental validation
To verify the effectiveness of the strategy proposed in this study under actual battery charging conditions, a comparison test between the optimized strategy proposed in this study and conventional multi-stage constant current charging strategy was conducted under two common battery charging conditions with different ambient temperatures and different initial SOCs.
3.1 Experimental platform construction
To verify the charging strategy proposed in this study,an experimental platform for power batteries was developed according to the existing conditions in the laboratory.The platform consists of the Arbin BT2000 multi-functional battery test system, DG-IS41 thermostat with a wide range of temperature settings, and a host computer.The Arbin BT2000 multi-functional battery test system can be set to test the battery in different charge and discharge modes,and the charging current can be programmed via the host computer.
3.2 Comparison of charging experiments under different ambient temperatures
The battery charging temperature was set to 10 °C, 20 °C,30 °C, 40 °C, and 50 °C.The battery was completely discharged before the experiment and charged to 10%SOC with 0.5C constant current charging.The battery was maintained in this condition for 1 h.Then, the battery was charged using the optimized charging strategy and the multi-stage constant current charging strategy proposed in this study, and the charging was terminated when the SOC reached 90%.The charging current, charging voltage,charging time, temperature rise, and other data were recorded during the charging process.The plots of the experimental results of charging at different ambient temperatures are obtained as shown in Fig.5, Fig.6, Fig.7, and Table 7.
Table 6 Charging current database
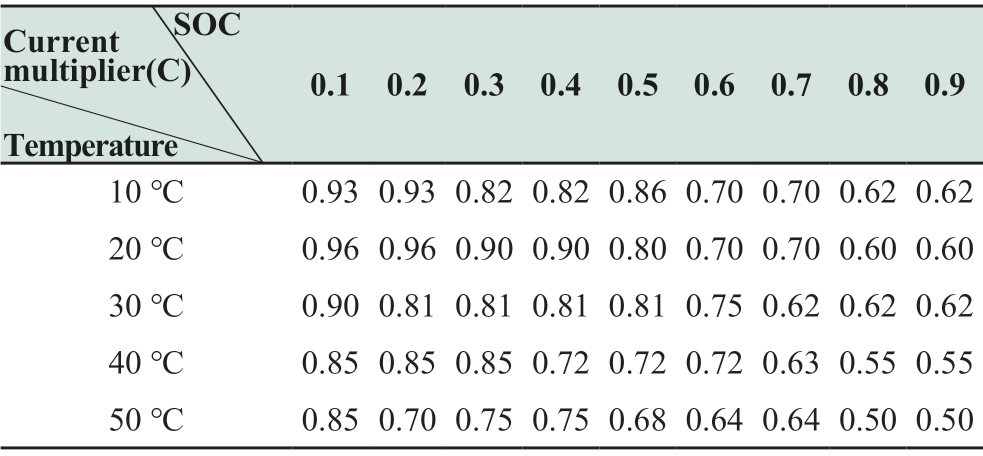
Table 7 Comparison of charging results at different ambient temperatures
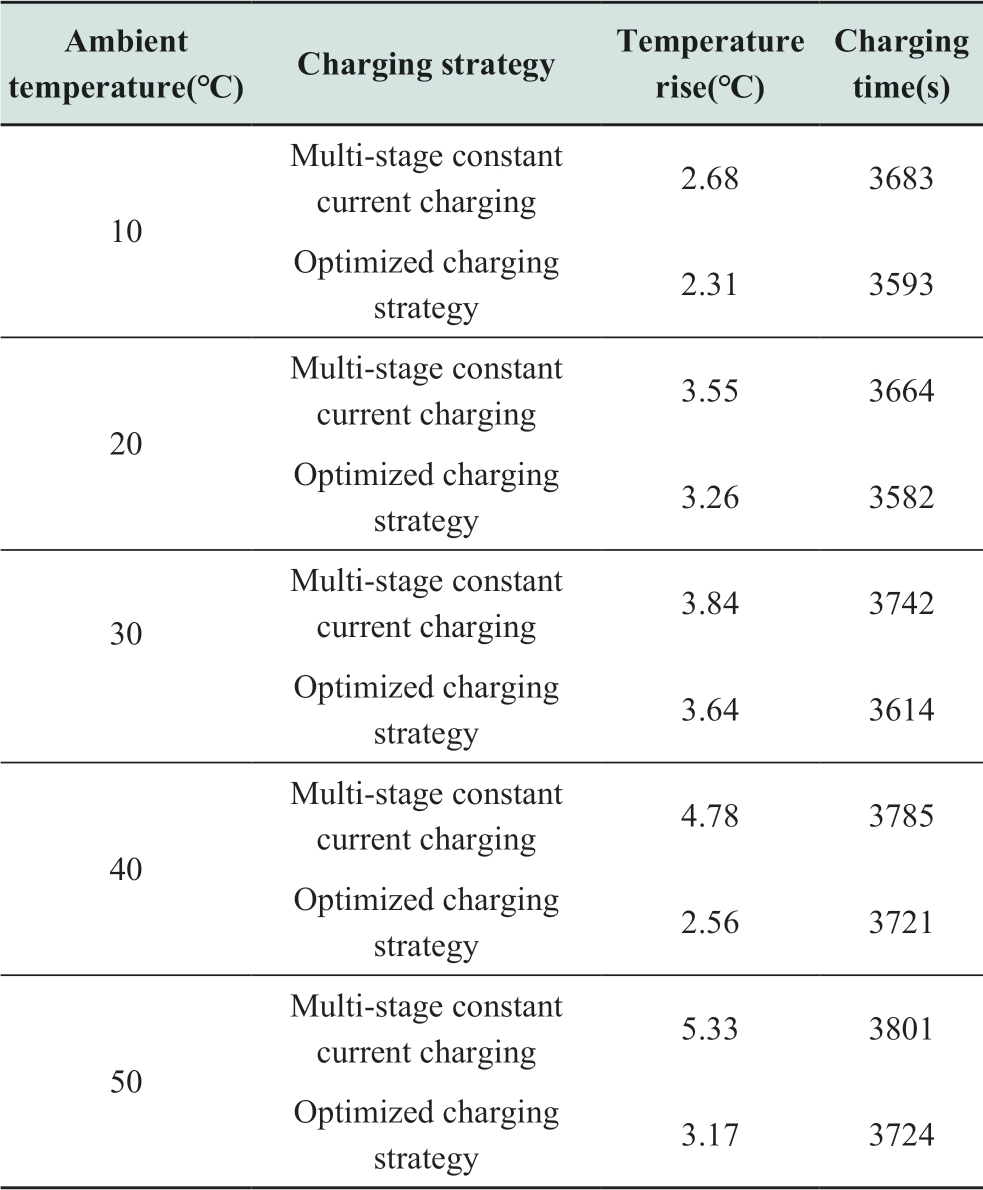
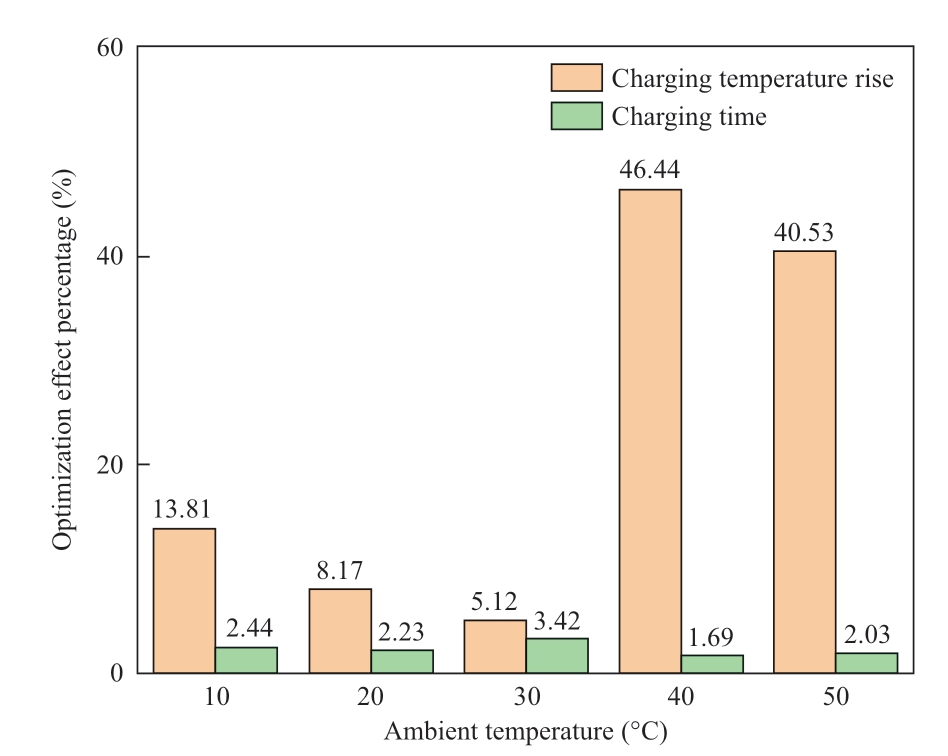
Fig.5 Optimization effect at different ambient temperatures
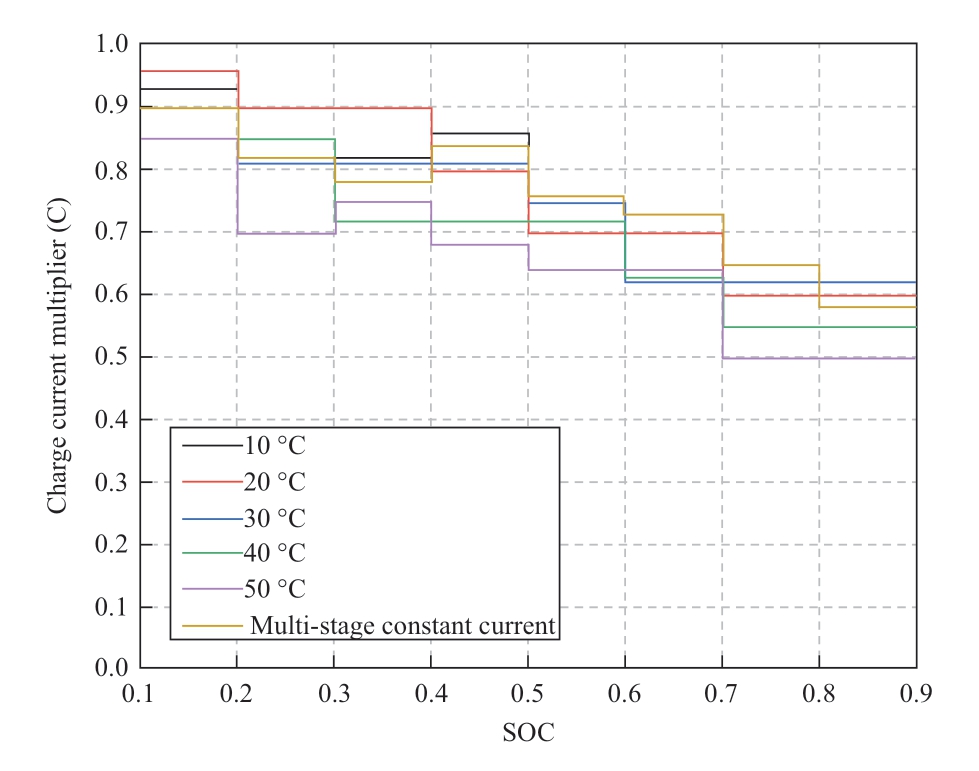
Fig.6 Charging current curves at different ambient temperatures

Fig.7 Comparison chart of temperature rise at different initial temperatures
Table 7 and the plots in Fig.7 show that the temperature rise for the two charging strategies are similar when the ambient temperature is below 30 °C.However, the charging time for the optimized charging strategy proposed in this study is reduced when compared to that of the multi-stage constant current charging.There is a maximum reduction of 3.42% in charging time.When the ambient temperature exceeds 30 °C, the temperature rise of the optimized charging strategy proposed in this study shows a better improvement over the multi-stage constant current charging strategy,where the temperature rise is reduced by up to 46.4%.The corresponding charging time increases slightly when compared to the lower temperature.However, it is still relatively short when compared to multi-stage constant current charging at the same temperature (1.9% shorter charging time).Hence, it can be shown that the optimized charging strategy proposed in this study exhibits a better charging performance at different charging ambient temperatures.
3.3 Comparison of charging experiments under different initial SOC states
Batteries with different initial SOC states were used for charging experiments to simulate the randomness of battery charging.The two groups of batteries (experimental group and control group) were completely discharged before the experiment, and then, the batteries were charged to the aforementioned three SOC states at constant current and left for a long enough period of time.Subsequently,the two groups of batteries were charged separately using the genetic algorithm-based multi-stage constant current charging strategy and conventional multi-stage constant current charging strategy.The parameters during the charging process were recorded.
Table 8 and Fig.8 show that the optimized charging strategy proposed in this study can effectively shorten the charging time when the initial SOC of the battery is low(e.g.10%).Furthermore, the temperature rise of the battery during charging is controlled within a reasonable range wherein the charging temperature rise is reduced by 8.1%and the charging time is shortened by 2.9%.However,when compared to the control group's multi-stage constant current charging strategy, the charging temperature rise is reduced by 4.1% and the charging time is shortened by 4.2%.However, this still has a better charging effect.Based on the above analysis, it can be concluded that the optimized charging strategy proposed in this study can shorten the charging time and reduce the charging temperature rise of the battery at different initial SOC states.
Table 8 Comparison table of experimental results with different initial SOC states
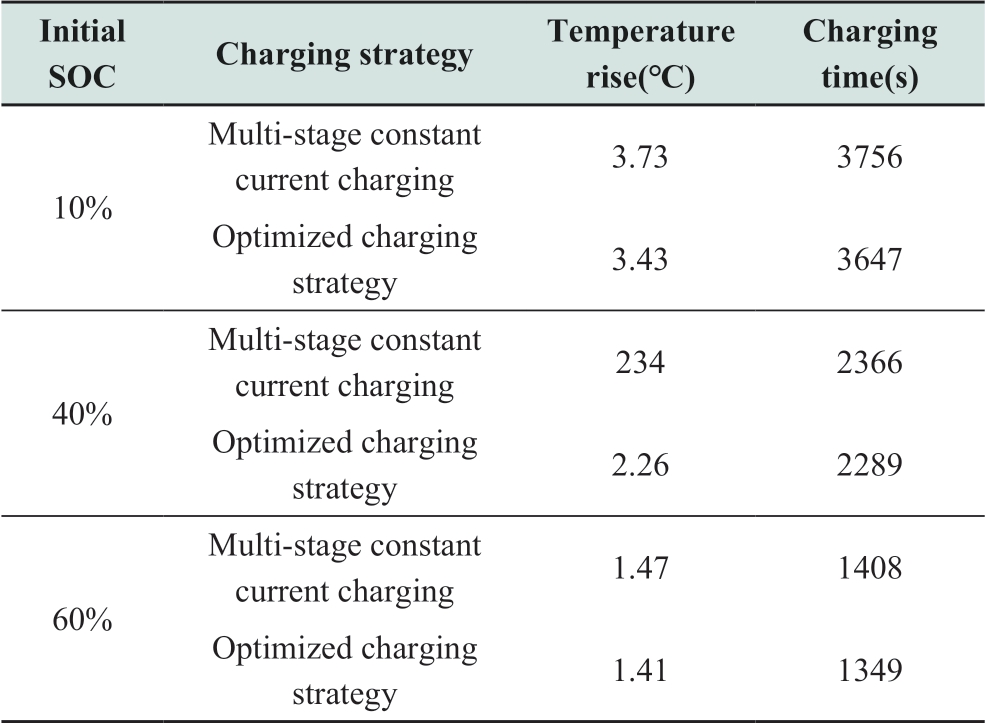
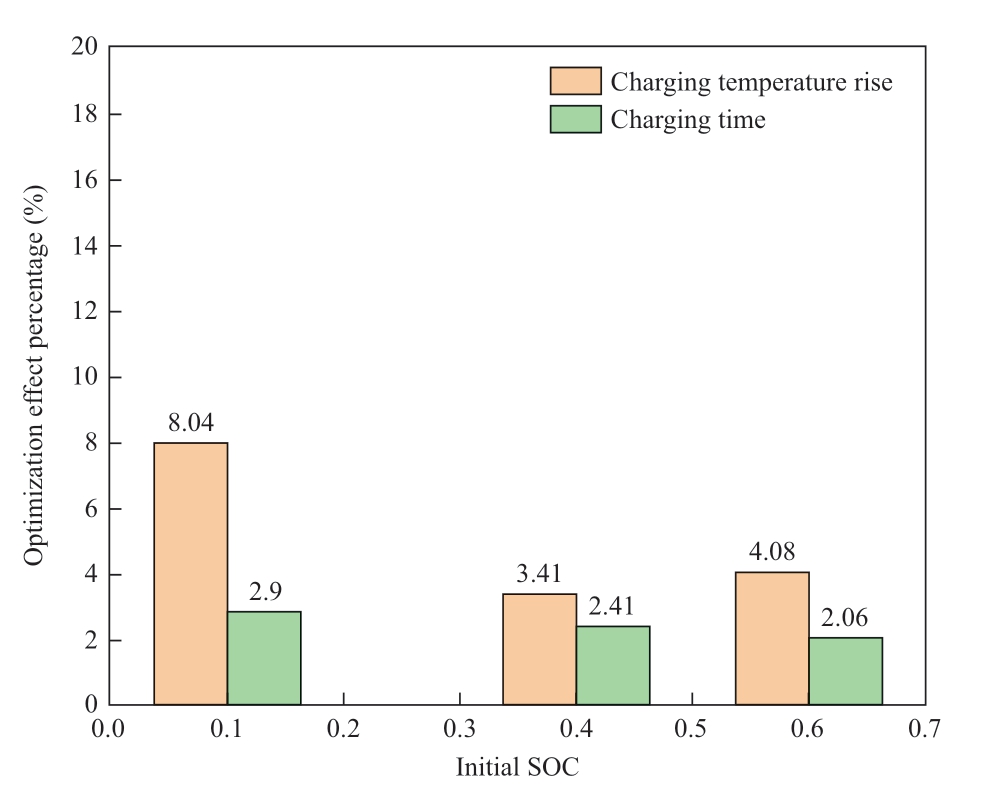
Fig.8 Experimental results of charging at different initial SOC states
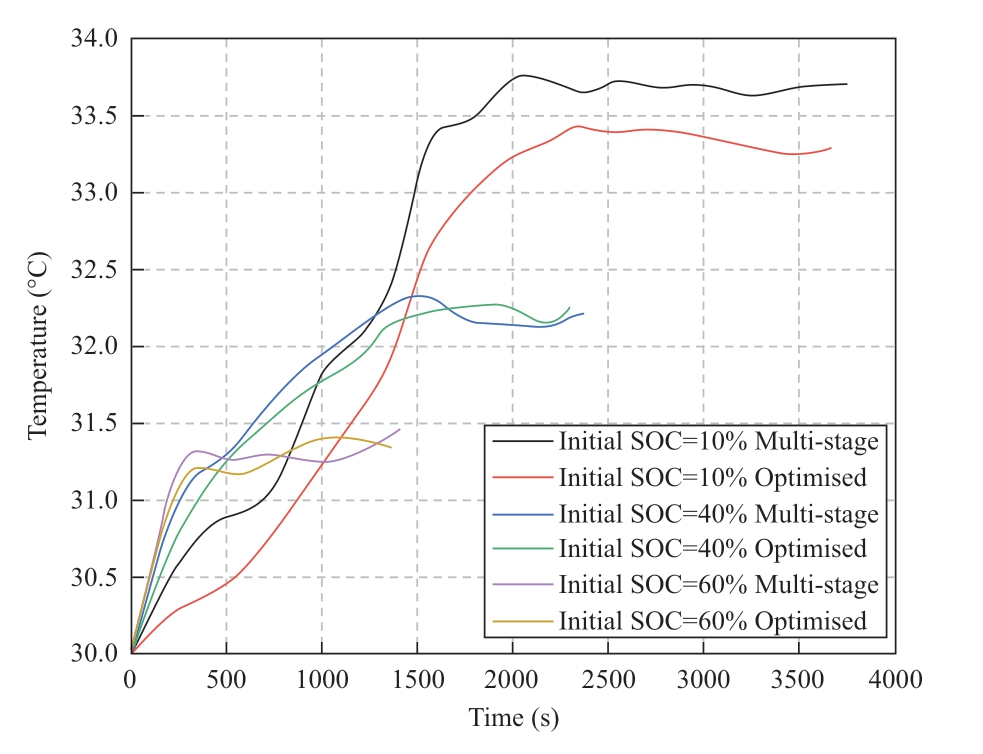
Fig.9 Plots of temperature rise for different initial SOC states
4 Conclusion
In this study, the mathematical derivation of the battery charging temperature rise characteristics is based on the establishment of a battery model.Then, a multi-stage constant current charging strategy is designed with the battery temperature rise during the charging process as the constraint, and the charging time is shortened as the objective.Furthermore, the current solution method and number of charging stages in the charging strategy are examined, and finally a database of battery charging curves containing different ambient temperatures is formed.Hence,the database of battery charging curves for different ambient temperatures is finally developed, and suitable current curves are selected from the database for charging according to different charging environments in practical applications.The experimental results show that the optimal charging strategy proposed in this study can reduce the amount of calculations under different battery charging conditions.Additionally, the temperature rise can be reduced by up to 46.4% and charging time can be reduced by up to 4.2%.
Acknowledgements
This work was supported by National Natural Science Foundation of China (Grant No.51677058).
Declaration of Competing Interest
We declare that we have no conflict of interest.
References
[1] Zeng Y Q, Chalise D, Lubner S D, et al.(2021) A review of thermal physics and management inside lithium-ion batteries for high energy density and fast charging.Energy Storage Materials,41: 264-288
[2] Tan Z F, Yang Y, Wang P X, et al.(2021) Charging Behavior Analysis of New Energy Vehicles.Sustainability, 13(9): 4837-4837
[3] Ginart A, Sharifipour B (2021) High penetration of electric vehicles could change the residential power system: public DC fast chargers will not be enough.IEEE Electrification Magazine,9(2), 34-42
[4] Yin Y L, Hu Y, Choe S Y, et al.(2019) New fast charging method of lithium-ion batteries based on a reduced order electrochemical model considering side reaction.Journal of Power Sources, 423: 367-379
[5] Wang J M, Wu J (2021) The optimal EV charging strategy in smart grid and insight into practical solutions.Journal of Physics:Conference Series, 1871(1): 012040 (6pp)
[6] Felix T, Niklas E, Jonas S, et al.(2021) Development and evaluation of a smart charging strategy for an electric vehicle fleet based on reinforcement learning.Applied Energy, 285: 116382
[7] Amin A, Tareen W, Usman M, et al.(2020) A review of optimal charging strategy for electric vehicles under dynamic pricing schemes in the distribution charging network.Sustainability,12(23)
[8] Yang X G, Zhang G S, Ge S H, et al.(2018) Fast charging of lithium-ion batteries at all temperatures.Proceedings of the National Academy of Sciences of the United States of America,115(28): 7266-7271
[9] Lee C H, Chen M Y, Shih-Hsien H, et al.(2018) Implementation of an SOC-based four-stage constant current charger for Li-ion batteries.Journal of Energy Storage,18pp.528-537
[10] Verena, Mueller, Rudi, et al.(2018) Importance of the constant voltage charging step during lithium-ion cell formation.Journal of Energy Storage, 15(feb.), 256-265
[11] Lee K B, A A M, Kang D K, et al.(2020) Deep Reinforcement Learning Based Optimal Route and Charging Station Selection.Energies, 13(23): 6255-6255
[12] Jiang L, Li Y, Ma J M, et al.(2020) Hybrid charging strategy with adaptive current control of lithium-ion battery for electric vehicles.Renewable Energy, 160 (prepublish): 1385-1395
[13] Jiang L, Li Y, Huang Y D, et al.(2020) Optimization of multistage constant current charging pattern based on Taguchi method for Li-Ion battery.Applied Energy, 259(C): 114148
[14] Chen Z, Shu X, Xiao R X, et al.(2019) Optimal charging strategy design for lithium-ion batteries considering minimization of temperature rise and energy loss.International Journal of Energy Research, 43(9): 4344-4358
[15] Lee C H, Chang T W, Hsu S H, et al.(2019) Taguchi-based PSO for searching an optimal four-stage charge pattern of Li-ion batteries.Journal of Energy Storage, 21: 301-309
[16] Wu T Z, Zhou C C, Yan Z, et al.(2020) Application of PID optimization control strategy based on particle swarm optimization (PSO) for battery charging system.International Journal of Low-Carbon Technologies, 15(4): 528-535
[17] Zhang C P, Jiang J C, Gao Y, et al.(2016) Charging optimization in lithium-ion batteries based on temperature rise and charge time.Applied Energy, 194: 569-577
[18] Wang S C, Chen G J, Liu Y H (2018) Adaptive charging strategy with temperature rise mitigation and cycle life extension for liion batteries.CPSS Transactions on Power Electronics and Applications, 3(3), 202-212
[19] Wu T Z, He S T, Ye F C, et al.(2018) Improved Five-Stage Constant Current Fast Charging Based on TM for Li-Ion Battery.Chinese Journal of Electron Devices,41(02): 339-345
[20] Liu K L, Li K, Yang Z L, et al.(2017) An advanced Lithiumion battery optimal charging strategy based on a coupled thermoelectric model.Electrochimica Acta, 225: 330-344
[21] Wang S C, Chen G J, Liu Y H (2018) Adaptive charging strategy with temperature rise mitigation and cycle life extension for liion batteries.CPSS Transactions on Power Electronics and Applications, 3(3): 202-212
[22] Li B, Parekh M H, Adams R A, et al.(2019) Lithium-ion battery thermal safety by early internal detection, prediction and prevention.Scientific Reports, 9(1)
[23] Chen Z, Shu X, Xiao R X, et al.(2019) Optimal charging strategy design for lithium-ion batteries considering minimization of temperature rise and energy loss.International Journal of Energy Research, 43(9): 4344-4358
[24] Chen Z, Shu X, Li X Y, et al.(2017) LiFePO4 battery charging strategy design considering temperature rise minimization.Journal of Renewable and Sustainable Energy, 9(6): 064103
[25] Nawazish A S M, Vivek S, Hossain M J, et al.(2021) Optimized energy control scheme for electric drive of EV powertrain using genetic algorithms.Energies, 14(12): 3529
[26] Pavai G, Geetha T V (2019) New crossover operators using dominance and co-dominance principles for faster convergence of genetic algorithms.Soft Computing, 23(11): 3661-3686
[27] Makeen P, Ghali H, Memon S (2020) Experimental and theoretical analysis of the fast charging polymer lithium-ion battery based on Cuckoo Optimization Algorithm (COA).IEEE Access, PP(99): 1
[28] Jarid S, Das M (2021) An Electro-Thermal Model based fast optimal charging strategy for Li-ion batteries.AIMS ENERGY,9(5): 915-933
[29] Yang J F, Cai Y F, Chris M (2022) Lithium-ion battery capacity estimation based on battery surface temperature change under constant-current charge scenario.Energy, 241
Received: October 16 2021/ Accepted: February 10 2022/ Published:April 25 2022
Si Xu
445832755@qq.com
Yu Zhang
zhangyu7210@163.com
TieZhou Wu
wutiezhou@163.com
2096-5117/© 2022 Global Energy Interconnection Development and Cooperation Organization.Production and hosting by Elsevier B.V.on behalf of KeAi Communications Co., Ltd.This is an open access article under the CC BY-NC-ND license (http: //creativecommons.org/licenses/by-nc-nd/4.0/ ).
Biographies

Yu Zhang She graduated from Hubei Institute of Technology in June 1992.Graduated from Hubei Institute of Technology in June 1999 with a master's degree in engineering.Professor, School of Electrical and Electronic Engineering, Hubei University of Technology.

Si Xu She graduated from Hankow College with a bachelor’s degree in 2017.Currently pursuing a master’s degree at Hubei University of Technology.

Tiezhou Wu He graduated from Huazhong University of Science and Technology with a Doctor of Science degree in Systems Analysis and Integration in 2010.Currently Executive Vice President of Hubei University of Technology Solar Energy Research Institute,Director of Key Laboratory of Solar Power Generation and Energy Storage Operation Control, Executive Vice Director of Hubei Collaborative Innovation Center for Efficient Utilization of Solar Energy.
(Editor Yanbo Wang)
