0 Introduction
Fossil fuels have been widely used since the previous century, leading to a significant improvement in productivity.However, their widespread usage leads to climate change, air pollution, and shortages in fossil fuels and poses serious challenges to the sustainable development of the society.A majority of countries agree that the carbon emission from fossil fuels should be minimized.In September 2020, Chinese President Xi Jinping delivered an important speech, proposing that China will adopt stringent policies and measures, striving to hit peak carbon dioxide emissions by 2030 and achieving carbon neutrality by 2060.
To achieve carbon neutrality by 2060, decarbonization in the energy sector is crucial because energy activities account for 86.9% of the total carbon dioxide emissions in China [1].There are basically two feasible pathways to be considered.On the one hand, fossil energy should be replaced by clean alternatives such as wind and solar energy.Based on the research report [2], to achieve carbon neutrality by 2060,the installed capacity of clean energy must account for approximately 96%, and power generation must account for 97%, leading to a highly variable renewable energy (VRE)-penetrated power system.On the other hand, fossil fuels must be replaced with clean-electricity sources.
The hydrogen produced from renewable power,such as wind and solar energy, is expected to be vital for approaching the objective of carbon neutrality and is referred to as power-to-hydrogen (P2H).First, P2H can decarbonize the production of hydrogen, which is traditionally generated from fossil fuels accompanied by intense carbon emissions [3].The P2H could be delivered through either the logistic supply chain or the pipeline to meet the hydrogen demand from distant chemical industries or any other hydrogen utility field.Second, large-scale hydrogen produced from VRE power could be stored for long durations and then either be fed back to the power system or delivered as a raw material depending on the requirement of the power system and the industrial demand.Owing to the intermittent and fluctuating nature of the hourly power output of wind and solar photovoltaics, largescale VRE curtailment was reported last year in China[4], and the curtailment could be significant owing to the increasing VRE penetration in the near future [5].Further,once the VRE penetration approaches the high level,long-term electricity storage equipment would become indispensable [6-9].This can be attributed primarily to the seasonal imbalance of electricity supply that cannot be compensated for by short-term flexible resources such as battery storage and hydro-pump storage [10-15].For such situations, hydrogen storage is a promising solution.Thus,P2H is an essential complement for a high-VRE penetrated power system, leading to the further minimization of carbon emissions based on the pattern of the energy system.
Thus, it is essential to study the optimization of the coupled electricity-hydrogen energy system instead of considering any of them individually, reducing the cost of investment in the energy system by taking advantage of the technological characteristics of electricity and hydrogen as well as their complementary benefits.Regarding the power system, various modeling methods have been proposed and successfully applied [16-24], and the more appropriate and efficient approach can be selected based on the purpose.As for modeling P2H, there is still an absence of a standard, complete, and reliable model.Thus,in literatures, modeling related to hydrogen technology is mostly customized based on the purpose of the study,for example, the model electrolyzer for coupling distinct technologies with the operation and control of the wind turbine [25] as well as the integration of the electrolyzer with the power system [26].Regarding hydrogen storage,Reuß et al.Reference [27] studied seasonal hydrogen storage using various types of carriers and transportation methods, focusing on a comparison of the economics involved in hydrogen supply.Nasri et al.Reference [28]studied the dual-power supply system, including renewable energy and hydrogen conversion, to achieve high efficiency and better performance through smart energy management.The contribution of hydrogen storage was evaluated by analyzing the highly VRE-penetrated California electric power system, and a comparison with the battery storage system was made by Colbertaldo et al [29].Li et al.[30]optimized the hydrogen supply chain and seasonal storage configuration to reduce the investment cost and improve the utilization of electrolyzers by incorporating the power grid.
The study of the optimization of the coupled energy system, involving the VRE power installation, P2H electrolyzer, hydrogen storage capacity, fuel cell that converts hydrogen to power, and so on, is essential for preliminary planning and policy making.However, toplevel design and optimization studies on the coupled electricity-hydrogen energy system are rare in the literature,particularly for a large continent or country such as China.Second, notwithstanding the available literature, the generalized value of hydrogen storage in future energy systems is still implicit.In this study, we construct a simplified electricity-hydrogen coupled model to simulate the hourly operation of the energy system and optimize the VRE installation, hydrogen plant, fuel cell capacity, and so on.Subsequently, we discuss several study cases with various hydrogen energy replacement rates in Northwest China with reference to carbon neutrality.We analyze the results of the optimization and discuss the benefits of hydrogen storage for improving the cost-effectiveness of the entire system.Thus, the hydrogen storage value for energy system is quantitatively evaluated.Finally, we propose the prerequisites of reducing the costs of hydrogen-related technologies to implement long-term energy storage for a power system.
1 Hydrogen production, transportation, and storage technologies
Hydrogen is produced from power mostly by the electrolysis of water.There are multiple approaches to this process.The alkaline water electrolysis technology is matured.It uses two nonchemically reactive electrodes inserted into the alkali metal hydroxide aqueous solution to conduct direct current.The schematic is presented in Fig.1.The cathode generates hydrogen gas and the anode generates oxygen gas.For proton exchange membrane electrolysis, a proton exchange membrane is used as the diaphragm, the cathode is Pt/C, and the anode is iridium oxide or ruthenium oxide.The investment required for this technology is relatively high.High-temperature solid oxide electrolysis is used to convert water into hydrogen and oxygen through an electrochemical reaction process at high temperature, with an energy conversion efficiency of up to 90%.This technology is immature and the lifetime of the equipment is short at present.In general, the water electrolysis method demonstrates high product purity(>99.7%) and low environmental impact.

Fig.1 Schematic of alkaline water electrolysis technology
Physical hydrogen storage technology is currently the most mature and widely used hydrogen storage technology[31], including high-pressure gaseous hydrogen storage and low-temperature liquefied hydrogen storage.Highpressure gaseous hydrogen storage technology is employed to compress and store hydrogen at high pressure, and its storage density is significantly impacted by pressure, that is, the storage energy density is limited by the material of the hydrogen storage tank.In low-temperature liquefied hydrogen storage technology, hydrogen is liquefied under high-pressure and low-temperature conditions using high volume density to achieve high-efficiency hydrogen storage.Physical storage is still costly owing to the relatively high amount of material required.Chemical hydrogen storage technology is promising; it mostly includes organic liquid hydrogen storage technology and liquid ammonia hydrogen storage technology.The organic liquid has high storage density under normal temperature and pressure, but the dehydrogenation reaction efficiency is low, and the purity may be impacted.In liquid ammonia hydrogen storage technology, hydrogen and nitrogen are reacted to produce liquid ammonia, which can be cracked to obtain hydrogen under normal pressure and 400 ℃.To reduce the cost of storing liquid ammonia, propane storage equipment can be used owing to their similarity.Other innovative hydrogen storage technologies such as inorganic hydrogen storage,methanol hydrogen storage, metal alloys, and carbonaceous materials are more convenient, cost-effective, and safe.
In terms of hydrogen transportation, gaseous hydrogen trailers, liquid hydrogen tank trucks, and gaseous hydrogen pipelines are primarily used for transportation depending on the specific requirement.The first two methods are more suitable for short-and medium-distance flexible transportation owing to low transportation efficiency and difficulties in controlling the conditions of transportation.Pipeline transmission is a good method for large-scale, longdistance hydrogen transportation.It can use the existing natural gas pipeline network to realize the transportation of natural gas mixed with 5%-15% hydrogen; it can also employ a pure hydrogen pipeline to transport gaseous and liquid hydrogen.The investment and construction cost of gaseous hydrogen pipelines is approximately 1.3-2 times that of natural gas pipelines, whereas the maintenance of liquid pipelines is technically difficult and costly owing to low temperatures.
2 Electricity–hydrogen coupled energy model
The general framework of the electricity-hydrogen coupling model (E-H model) used in this study is schematically demonstrated in Fig.2.This model employs the LP (linear programming) method with the aim of determining the lowest total cost of the entire energy system,as described in formulas (1)-(5).We use the commercial optimization solver Gurobi to perform the calculations required for the optimization.

Fig.2 General framework of the E–H model
The model realizes the integration of the power system and the hydrogen/methane production and transportation model at hourly intervals.It considers the production and demand at multiple nodes, coupling electricity and hydrogen technologies involving renewable energy power generation,energy storage, hydrogen production, methane synthesis,long-distance power, hydrogen and methane transmission,and so on.
2.1 Electricity–hydrogen modeling
The electricity model is combined with both power system operation simulation and capacity expansion planning.The pipeline model [32-35] is adopted, which is constrained only by Kirchhoff’s current law (KCL), that is,only the balance and transmission constraints are complied with at each node [36].Targeting the top-level design, the electric model is significantly simplified such that only one node is considered in a relevant region, whereas the capacity expansion planning is realized under the constraints of the upper and lower bounds of installed capacity for the generation units, battery storage, and power transmission capacity.The detailed mathematical expressions, including those for the generation unit, transmission line, and battery storage operation constraints, are presented in Section 2.3.
Hydrogen modeling mostly considers the electrolyzer and hydrogen transportation and storage.Similarly, we assume that in each region, the electrolyzer and storage are regarded as one device, that is, only cross-regional transportation is considered, although the hydrogen production, transportation, and storage in each region also follow the abovementioned capacity expansion and operation simulation constraints.See Section 2.3 for details.
The coupling of these two models is realized by enabling a technical connection between electricity and hydrogen.The electrolyzer is connected to the power system for electricity.Thereafter, the produced hydrogen can either be locally consumed directly or stored for later usage,even transported to another region.Analogically, synthetic methane, as a downstream product made from hydrogen, is connected to the electricity-hydrogen system as well.
2.2 Optimization
The objective function of optimization minimizes the overall annual cost:
where Ctot denotes the total annualized cost, Cinv and Cfix denote the annualized investment cost and fixed operating costs, respectively, Cvar denotes the annualized variable operating costs, and Cfuel denotes the fuel cost.
· Investment cost:
where R is the capital recovery factor, and the weighted average cost of the capital is 0.08.The depreciation period for all technologies is 20 years, except for hydrogen and methane transmission, for which it is 40 years.Uinv,p is the investment cost per unit production capacity of a certain type of technology process p in the system, which can represent power generators including wind and photovoltaic(PV) types; hydrogen and methane plants; and storage and transmission of power, hydrogen, methane, and so on.kp represents the production capacity of the technology process p.
· Fixed operating cost:
where Ufix,p is the fixed operating cost per unit production capacity.
· Variable operating cost:
where Uvar,p is the variable operating cost per unit production capacity and ap,t is the output at t hours.
· Fuel cost:
where Gp,f,t is the price of fuel at t hours required by technology process p.
2.3 Operation simulation constraints
The simulation constraints for the operation of both the power system and the hydrogen/methane network are summarized in formulas (6)-(16), including power generation, electrolysis, power transmission, hydrogen/methane transportation, battery and hydrogen/methane storage operation, and material/energy balance.The fluctuation curve of VRE generation and the loads of electricity, hydrogen, and methane are assumed to be the specified boundary conditions.Thus, the optimal technology combination is proposed, which achieves the lowest total cost.
· Power generation:
The equation indicates that, for any technology, the output does not exceed its capacity at any time.
· Capacity flow:
The ramp-up and ramp-down productivity of each technology process follows a certain rate:

where kp is the production capacity of the technology process p,  and
and  denote the minimal and maximal unit activities of the technology process p, and Xpmax is the maximum unit activity ramp-up and ramp-down speed.
· Electrolyzer:
The electrolyzer is simply modeled as an energy conversion technology from electricity to hydrogen, as the input of electricity and the output of hydrogen are of utmost concern in the E-H model.The model of the electrolyzer is formulated as follows:
The equation indicates that for the electrolyzer, the output does not exceed its capacity at any time.
· Power transmission and hydrogen/methane transportation:
The transmission is reversible and the capacity for both the directions is equal.
The equation indicates that the actual transmission volume at any time t does not exceed its transmission capacity.Here, n is a node, n′ is another node, nn′ represents the transmission direction, and l is the transmission line.
where ηnn′,l,m is the transmission efficiency of the commodity m on the transmission line l.
· Energy storage operation:
Energy storage modeling for both the battery and hydrogen/methane uses a generalized operating model, and its operating constraints are as follows:
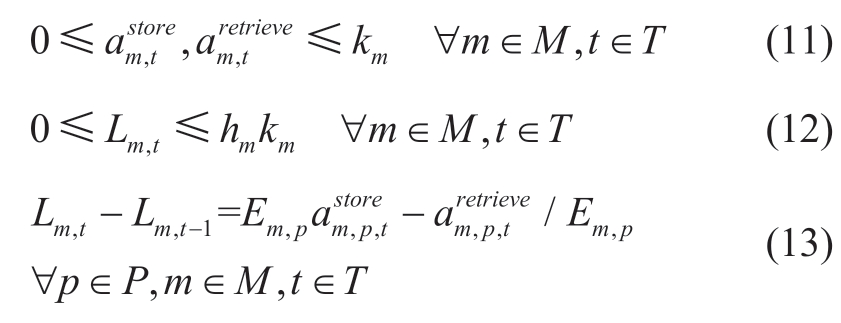
Formula (11) constrains the storage and retrieval power,represented by  and
and  of the energy storage device such that it does not exceed the upper limit.In formula(12), km is the upper power limit of the storage device for the commodity m, hm represents the continuous retrieval time, that is, it indicates that the retained energy level Lm,t of commodity m does not exceed the capacity.Formula (13) is the energy balance equation of energy storage for adjacent periods, limiting the retained energy level for commodity m at any instant of time, and Em,p represents the process efficiency for storage and retrieval.
· Material/energy balance
For any commodity m, which can be electricity,hydrogen, or methane, the stored, retrieved, and retained material or energy at any instant of time must be balanced:
where f in and f out denote the inflow and outflow of the commodity m.For example, electricity is governed by Kirchhoff’s current law.bm,t is the retained m at time t.
If m is tradable, the amount available for sale at time t is expressed as
where dm,t is the sales volume or demand of commodity m at time t.
· Material/energy conversion:
Material and energy conversions follow a preset conversion efficiency:
where f in and f out are the inflow and outflow of the commodity m and Ep,m,t is the conversion efficiency of the commodity m in the process p.
2.4 Capacity expansion constraints
Capacity expansion constraints limit the newly built capacity for any expandable technology in each region,such as wind and solar generation units, power transmission methods, electrolyzers, batteries, and hydrogen storage, as shown in Equation (17).
 represents the newly built capacity for technology process p of the commodity m,
 and
and  denotes respectively the lower and upper limit for the newly built capacity.The objective function of optimization (1) and operation simulation constraints (6)-(16) hold with the newly built capacity investment and operation cost added.
3 Case study
3.1 Case construction
Northwest China is rich in renewable energy resources such as wind and solar energy.According to a report [2],the VRE penetration in Northwest China will exceed 80%by 2060, and the outbound delivered electricity is expected to reach 1.5 PWh, accounting for approximately 40% of the total annual power generation.As a significant clean power generation base in China, the Northwest region is chosen to be the research object in this case study, and two nodes are involved: the Northwest region and the external region.
The energy products involve three varieties: electricity,hydrogen produced by the electricity through the electrolyzer, and methane synthesized from hydrogen.The technical connection diagram among the energy products is sketched in Fig.3.
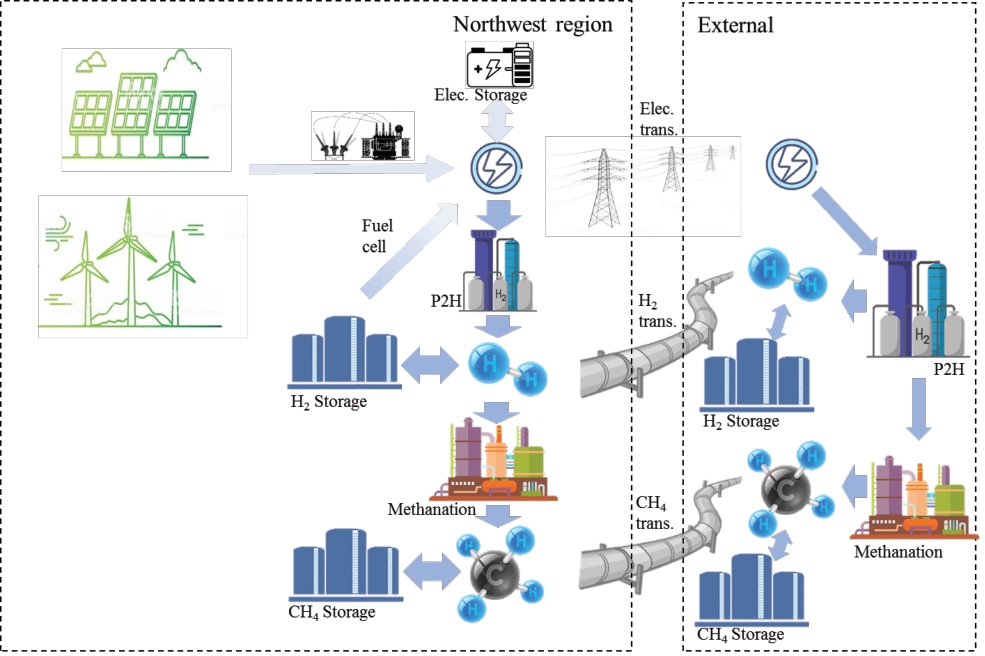
Fig.3 Technical connection diagram
Northwest China produces electricity to balance the local and external energy demand levels.The two nodes are linked through transmission technology, that is, the electricity transmission grid and hydrogen/methane pipelines.When the power output exceeds the demand, the surplus electricity could be stored in batteries, consumed to produce hydrogen or curtailed.Hydrogen could be stored and later retrieved when required or converted to power using a fuel cell.Hydrogen is also the raw material used to synthesize methane when combined with CO2.The external regions are equipped with hydrogen and methane synthesis units.Therefore, the demanded hydrogen and methane are either directly transported from the Northwest region or produced locally using the received electricity, enabling the competition between electricity and hydrogen/methane transmission.
Several assumptions are made in the E-H optimization model to simplify the following calculation:
· The generation mix is divided into three parts, namely,VRE power including wind and solar PV, concentrated solar power (CSP), and the rest of the power units such as gas and biomass generators.
· The capacity of wind and solar PV, transmission line,short-term battery storage in the power system as well as the electrolyzer, hydrogen storage, and fuel cell are considered as variables to be optimized.The fluctuation curve of VRE generation, electricity, and hydrogen load are assumed to be the specified boundary conditions.
· The focus is on planning for a single year so that the capital cost of the infrastructure is converted into an equivalent uniform annual cost.
3.2 Technical parameters
The data of energy supply and demand prediction are acquired mostly from the research report [2].The data include the predicted energy demand containing the power load, demand for hydrogen and methane as well as their demand characteristics, the predicted installed capacity,and the electricity generation mix of non-VRE units in the carbon-neutrality scenario.Further, the cost parameters of each component are collected, which include the investment cost, annual fixed cost, and variable costs, by referring to the report entitled “Development and Outlook on Renewable Energy Power Generation Technology” [37].
In terms of generators, three renewable energy power generation technologies are considered, namely, wind,photovoltaic power, and solar thermal power.Based on the Global Renewable-energy Exploitation Analysis (GREAN)platform developed by the Global Energy Interconnection Development and Cooperation Organization (GEIDCO),the 8760 h VRE output characteristics in the Northwest region involving three different resource levels are extracted and represented by the weekly averaged available capacity factor, as depicted in Fig.4, indicating the VRE resources endowment and seasonal change features.In the E-H model, the wind and solar PV technologies involve three generator units with different resource levels.In addition, a total of 105 GW produced by other types of generators, i.e.,hydropower, natural gas power, biomass, and so on, is also involved.
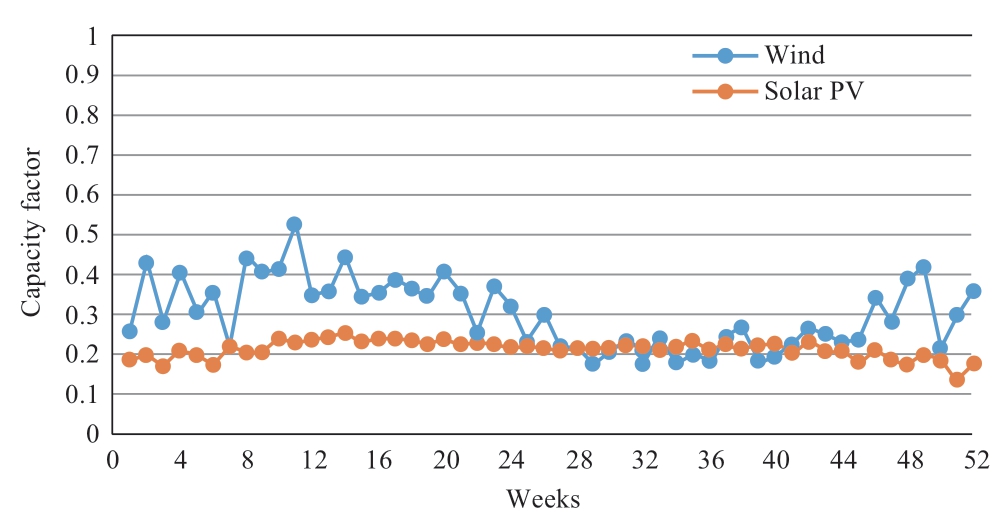
Fig.4 Wind and solar weekly output characteristic
The total energy demand in Northwest China is projected to be approximately 4.1 PWh [2] under carbon neutrality,of which the outbound delivered energy, that is, the energy demand from regions external to Northwest China, accounts for 36%.The total energy demand includes the demands of electricity, hydrogen, and gas, and the hydrogen demand is estimated to be as high as 16% of the total.
Considering various levels of electrification and hydrogen replacement patterns on the energy consumption side, two more cases are considered for comparison: one with no hydrogen/gas energy demand and another with a low proportion of hydrogen/gas energy demand.Thus, three study cases are considered with the proportions of hydrogen and gas demand accounting for 0%, 8.7%, and 16% of the total energy demand, while the total energy demand remains unchanged.The energy demand mixes of the latter two cases are depicted in Fig.5.
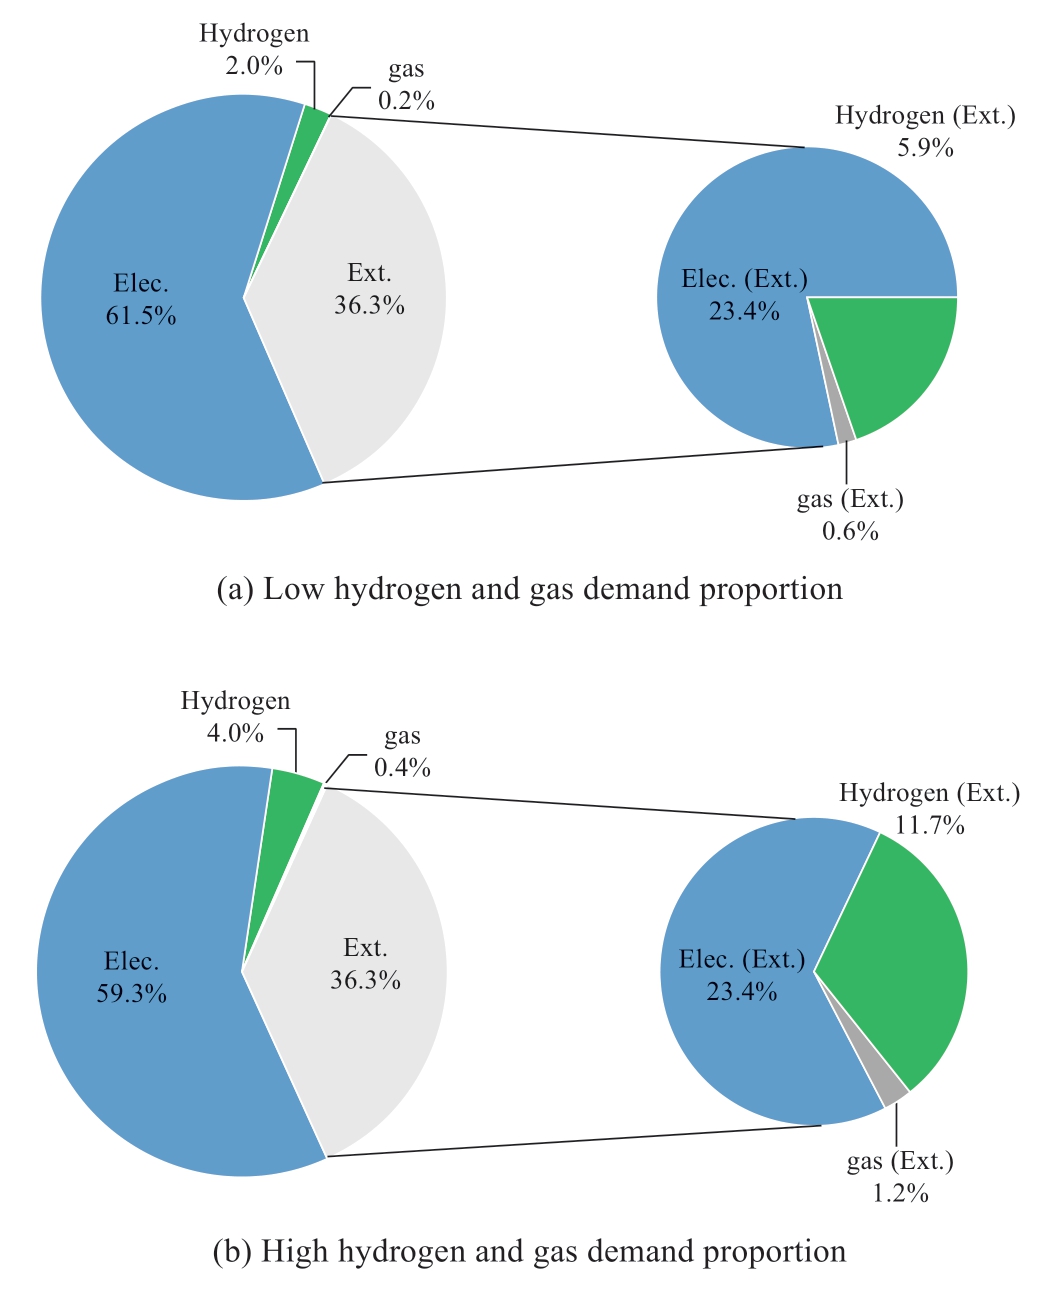
Fig.5 Energy demand mix
In terms of hourly energy demand characteristics,the hourly power load in Northwest China is assumed to follow the historical load curve, and the maximum load is predicted to be approximately 370 GW.The power load characteristics of the external node follow the historical load characteristics of East China, which is the main receiving area for power delivery from West China.For hydrogen and gas, the monthly demand characteristics are considered by referring to the historical monthly natural gas consumption,which indicates high demand during winters and low demand during summers.The monthly demand trend of hydrogen and gas is resented in Fig.6.
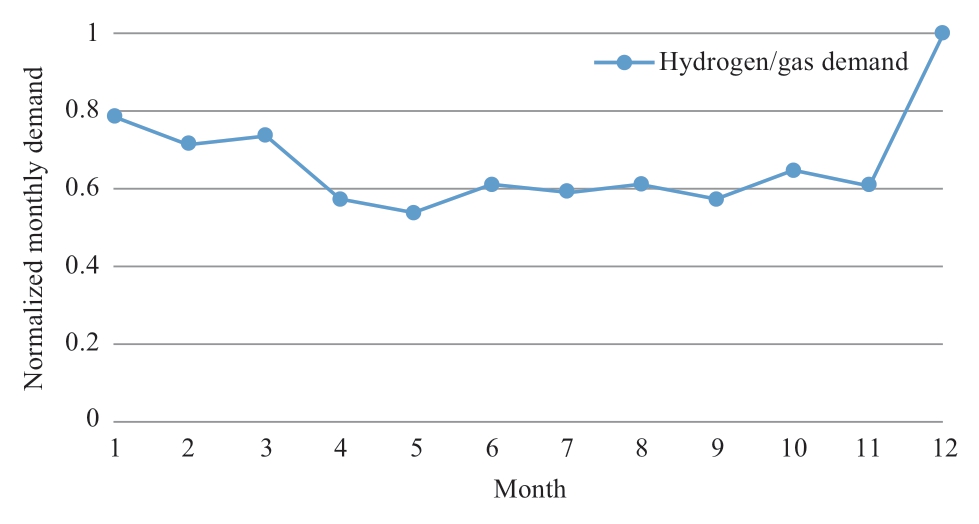
Fig.6 Monthly demand trend of hydrogen and gas
For the energy conversion and storage efficiency, we assume a remarkable cost drop for producing hydrogen while maintaining 90% conversion efficiency, as introduced in Section 1.Fuel cells have achieved an energy conversion efficiency of above 50% [38] currently; thus, a moderated progress to 59% is possible.A generalized 10% spillage for hydrogen and methane storage is estimated for simplicity.The efficiency details are summarized in Table 2 in the Appendix.
3.3 Cost prediction
The cost parameters for each technology generally consist of the initial investment cost, fixed operation cost,and maintenance cost.The investment cost parameters of the generation units of wind, solar PV cells, CSP, and battery storage are estimated quantitatively by implementing the technology readiness level (TRL) method [37].The TRL method quantifies the progress in technology as the scale effect of installed capacity is considered [37].The cost parameters are addressed by establishing a relationship between the investment and the TRL.The cost factors are summarized in Table 1 of the Appendix.
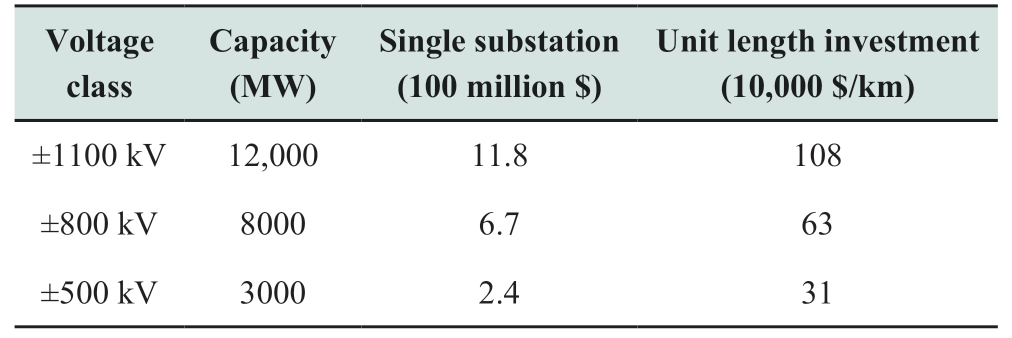
According to the prediction data from a published report[39], the power transmission cost of high-voltage, direct current (HVDC) technologies at distinct voltage levels tends to stabilize until 2060 owing to large-scale application and practice (see Table 3 in the Appendix).
The production, transmission, and storage costs of hydrogen and methane are summarized in Table 1 in the Appendix.As there is no large-scale, long-distance prototype project of hydrogen transportation available for reference, we adopt a cost parameter of 1.5 times that of natural gas pipelines [40], as introduced in Section 2.With equipment scale enlarging and the utilization rate increase,the cost of both water electrolysis and fuel cell are predicted to be 2.16 yuan/m3 in case of 3000 h of annual full-load utilization hours, that is, an approximately 30% decline to the current water electrolysis cost level.
3.4 Results and discussion
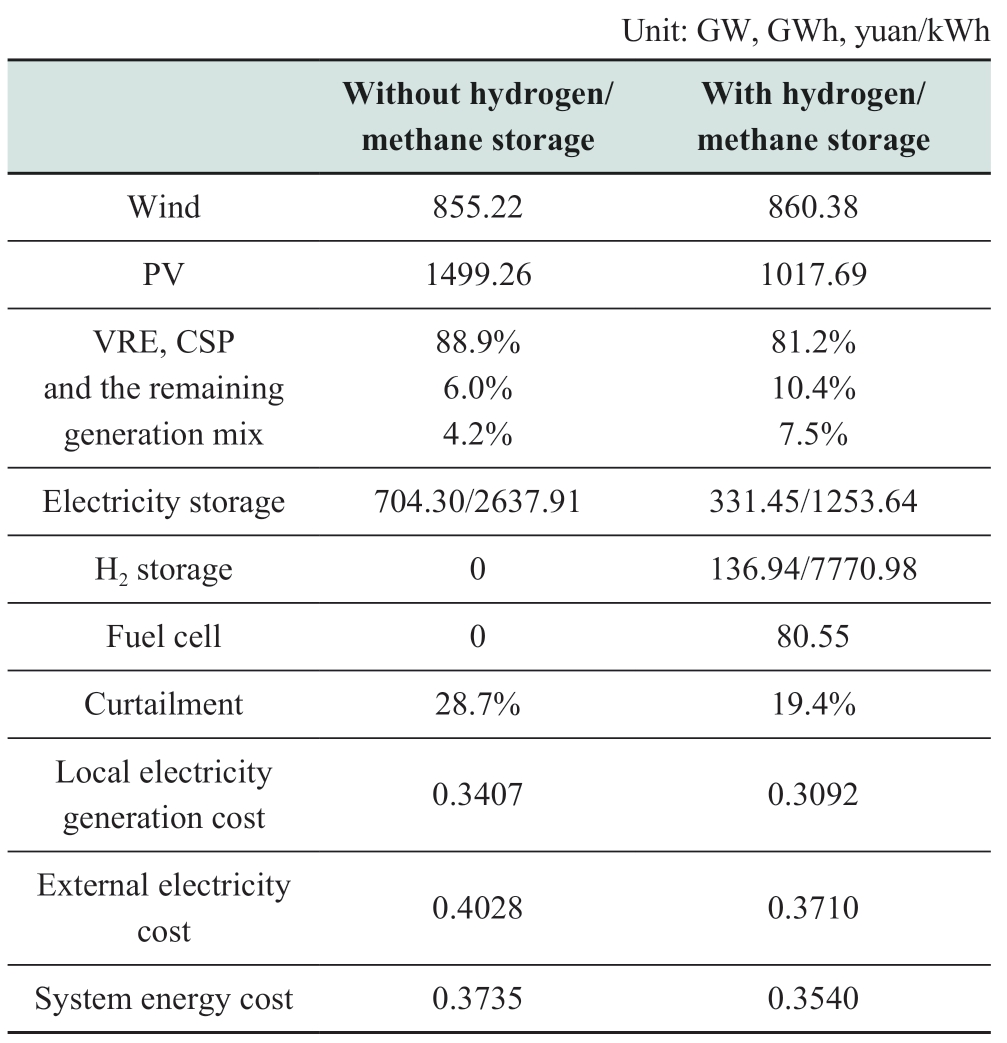
To evaluate how hydrogen storage can improve the flexibility of the system, we consider two conditions:hydrogen storage enabled and disabled.The results are presented in Tables 1-3.
· Case I
The results of the optimization are demonstrated in Table 1.As there is no hydrogen or gas demand, all the hydrogen created by electricity is eventually fed back to the power system.The optimized hydrogen creation, storage,and fuel cell compose long-term energy storage for power systems, which is required owing to the lack of flexibility.When long-term storage is enabled, an overall energy cost reduction of 5.2% can be expected as less VRE and battery capacity are required.The VRE curtailment is cut down from 28.7% to 19.4% mostly owing to generation and demand rebalancing over a long term, which is assisted primarily by hydrogen storage instead of solely by battery.In this sense, hydrogen storage could ease the power demand imbalance and reduce the investment required in battery storage, complementing the short-term battery storage to operate at various time scales.
Table 1 Results of evaluation for no hydrogen/gas demand
· Case II
In this case, the hydrogen/gas demand accounts for 8.7%of the total energy demand.The results of the optimization are presented in Table 2.In this case, the overall energy cost reduces by 9.6% and the VRE curtailment is cut down from 29.3% to 17.7% owing to the introduction of hydrogen storage.In this case, hydrogen storage could ease the supply and demand mismatch for both electricity and hydrogen energy at a distinct time scale and contribute toward reducing the overall energy supply investment.Furthermore,the hydrogen-to-power conversion process is still favored,resulting in a fuel cell capacity of 31 GW.This indicates that the hydrogen storage partially works as an electricity storage unit for the power system.
Table 2 Results of evaluation for low hydrogen/gas demand
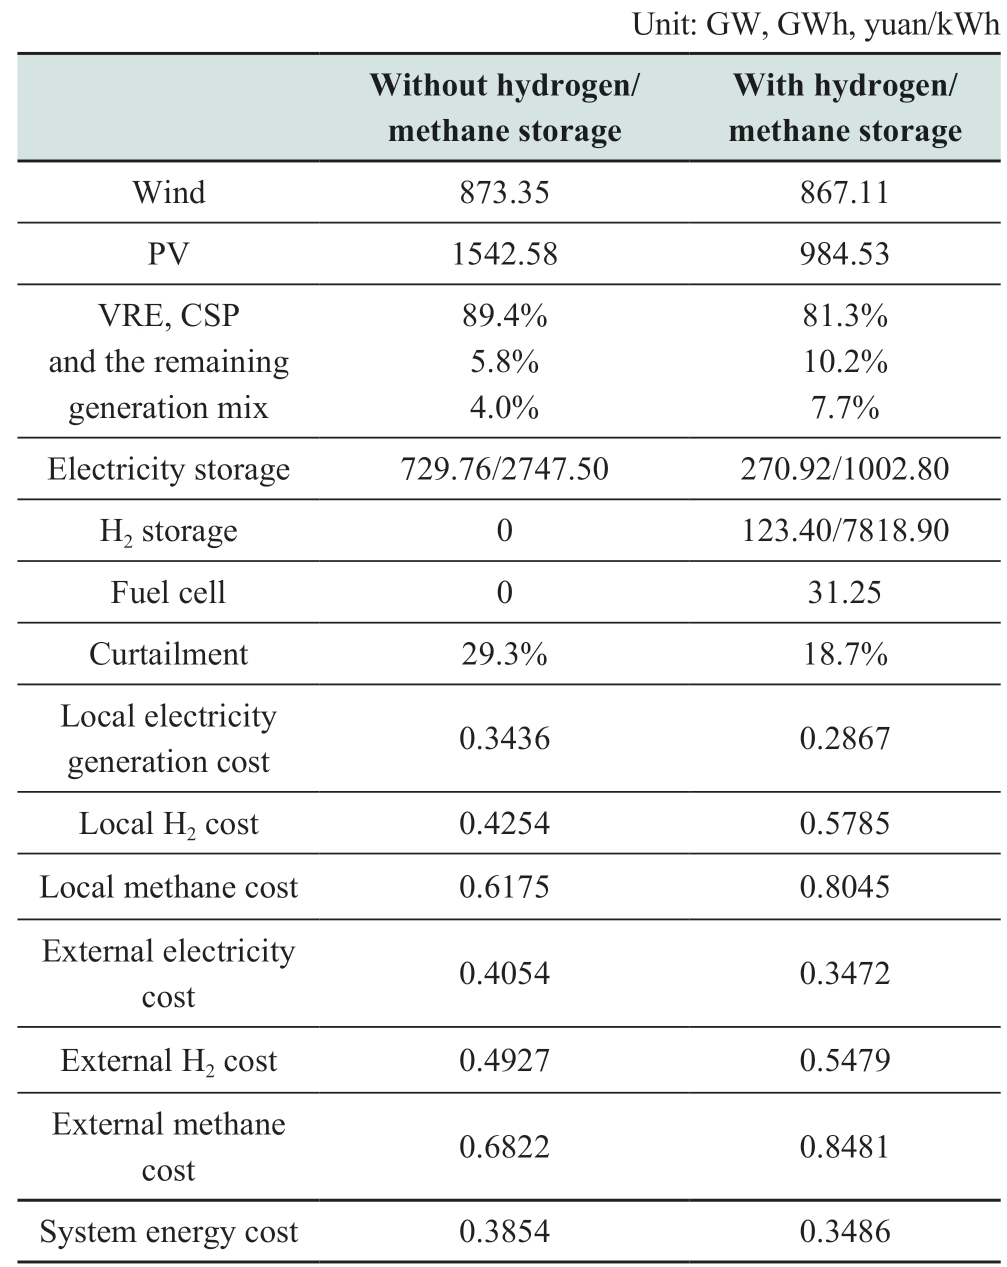
As compared with Case I, the system needs more VRE and battery capacity in the absence of hydrogen storage.However, with hydrogen storage enabled, in Case 2, the system needs much lower VRE and battery capacity, and the fuel cell is still effective when compared with a battery in balancing the seasonal change in power demand.This can be explained as follows.On the one hand, hydrogen storage could fulfill more efficiently with the hydrogen demand rather than power demand which requires hydrogenelectricity conversion.This can be attributed to the fact that the hydrogen demand changes on a monthly basis, which can be balanced more appropriately by long-term hydrogen storage.On the other hand, the P2H process can be more suitably arranged depending on the VRE generation and power demand, leading to a better power balance in the long term.Therefore, the hydrogen storage advantage is further enabled upon improving the flexibility of the system.
For Case 2, the hourly power balance on the maximum net load day is compared between with and without hydrogen storage conditions, as depicted in Fig.7.The actual electricity load is the sum of the original load, the net stored electricity, that is, the stored electricity minus the retrieved electricity, and the transmission loss.In the absence of hydrogen storage, the P2H output is maintained constant throughout to meet the hydrogen demand, leading to surplus VRE installation and battery capacity to make up for possible power shortage during low-generation hours.On the contrary, when hydrogen storage is enabled,the P2H process could be optimally arranged to operate at full capacity around mid-day, when significant solar PV is generated.When the VRE generation is insufficient,the power demand must be fulfilled instead of producing hydrogen; thus, the stored hydrogen is retrieved.
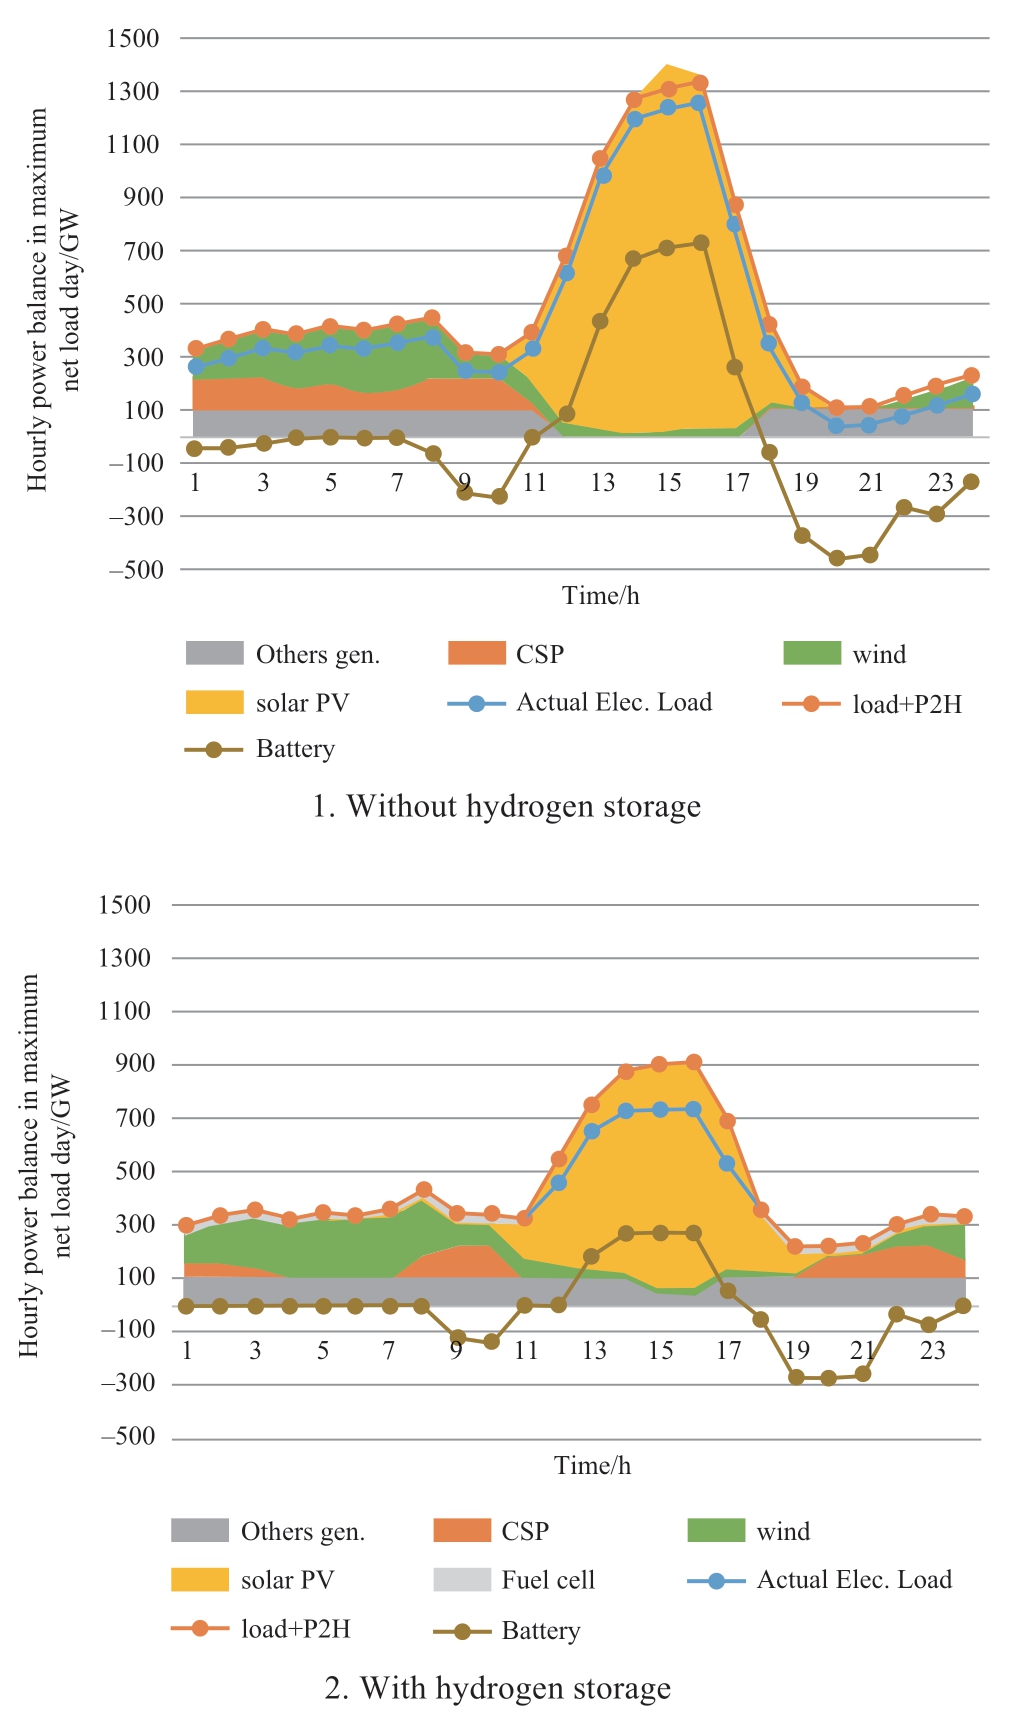
Fig.7 Hourly power balance
· Case III
The results of the optimization for the high hydrogen/gas demand case are presented in Table 3.Similarly, the system energy cost reduces by 12% after the introduction of hydrogen storage, and the VRE curtailment drops from 29.9% to 17.9%.However, the hydrogen-to-power conversion process is not favored in this case, and the hydrogen storage expands, whereas the battery shrinks because the increased hydrogen demand and monthly change require more hydrogen storage to buffer against the fluctuating VRE generation.Consequently, the power system obtains sufficient flexibility from the side adjustability of P2H consumption, and hydrogen-electricity conversion is not required.
Table 3 Results of evaluation for high hydrogen/gas demand
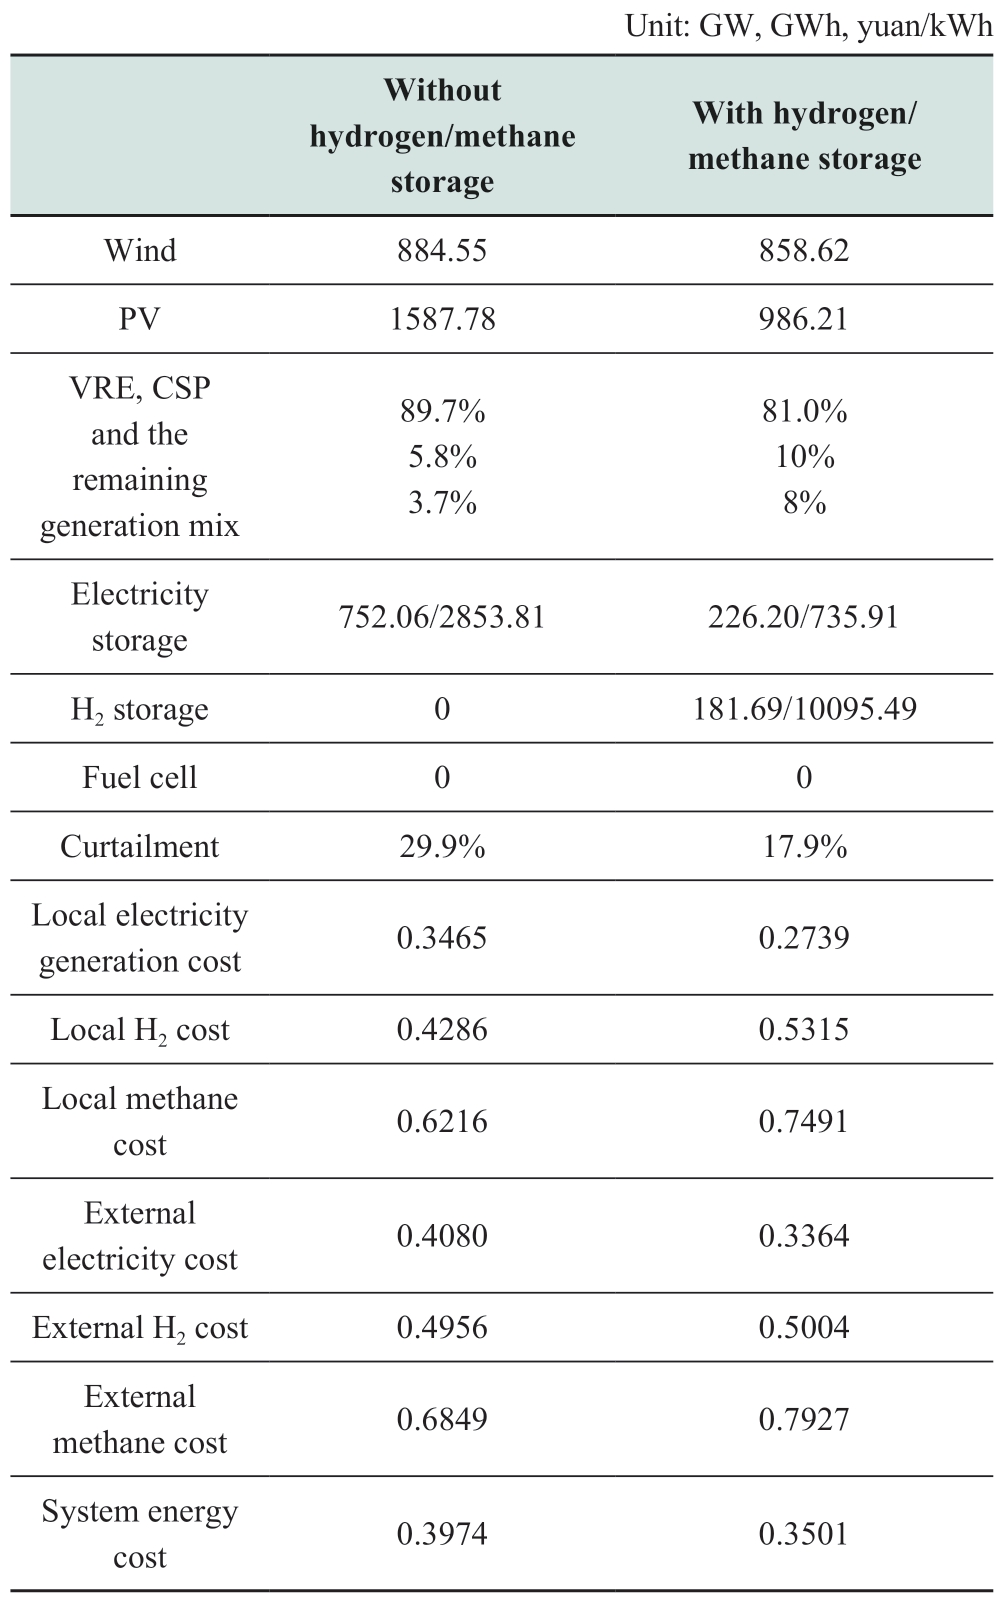
Regarding the cost, among these three cases, the overall energy cost increases with the proportion of hydrogen and gas demand in the absence of hydrogen storage.This can be attributed to the fact that the overall energy efficiency declines with increasing electricity loss from the P2H process, leading to slightly increased curtailment and thus higher power supply and investment requirement.Moreover,for each case, the hydrogen storage effect on cutting down the energy cost becomes more significant with the increase in the hydrogen and gas demand.This proves that hydrogen storage improves the system flexibility, leading to a significant reduction in the total investment.It should be noted that the overall energy cost increases marginally along with the hydrogen and gas demand among these three cases,although the electricity cost for both the local and external regions continues to decrease.It is because the degradation of the efficiency of the energy system dominates, leading to an increase in the energy cost in spite of the increased VRE utilization rate.
3.5 Sensitivity analysis
Based on Case 3 with high hydrogen and gas demand,we conduct a sensitivity analysis of fuel-cell requirement on hydrogen-related technologies cost to determine the economic and functional implications of long-term hydrogen storage for power systems.Hydrogen-related technologies include three aspects: P2H, hydrogen storage,and fuel cell capacity.We construct a series of cases with the cost of hydrogen-related technologies dropping down to 40% of the predicted cost, as introduced in Section 3.3.
The results of optimization of the battery and hydrogen storage as well as the fuel cell capacity are presented in Fig.8.As we can see, when the cost of hydrogen-related technologies decreases by approximately 20%, the system enables hydrogen-to-power conversion.Thus, the hydrogen storage starts to work as a long-term energy storage as well for the power system, in addition to connecting the VRE power and raw material to fulfill the hydrogen and gas demand.Along with the deceasing cost of hydrogen,the hydrogen storage and fuel-cell capacities continue to increase owing to the cost-competitive promotion of longterm storage as compared with battery storage, supporting the economic operation of the power system.
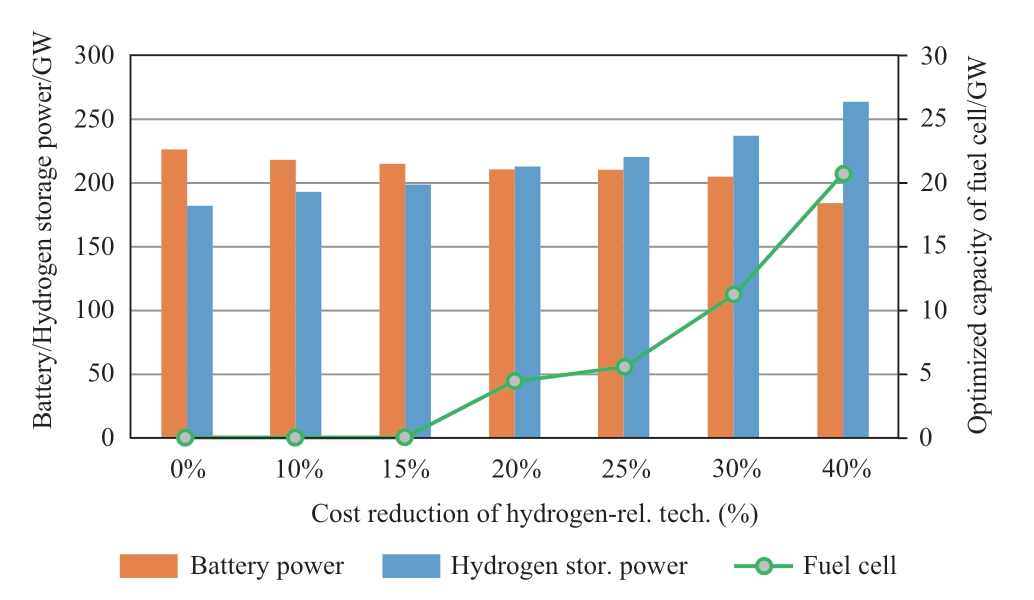
Fig.8 Results of sensitivity analysis
Regarding the production cost of each energy form, as depicted in Fig.9, the decline in hydrogen cost contributes distinctly to the final cost of electricity, hydrogen, and gas for local and external use.It impacts the methane cost the most, whereas the impact on electricity is the least.The intersection of hydrogen local and external cost is worth noting: the local production of hydrogen turns out to be cheaper as compared with external production, and the hydrogen transmission system starts to work to deliver the locally created hydrogen to external destinations.A comparison of electricity and hydrogen transmissions is out of the scope of this study and will be carried out in the future.
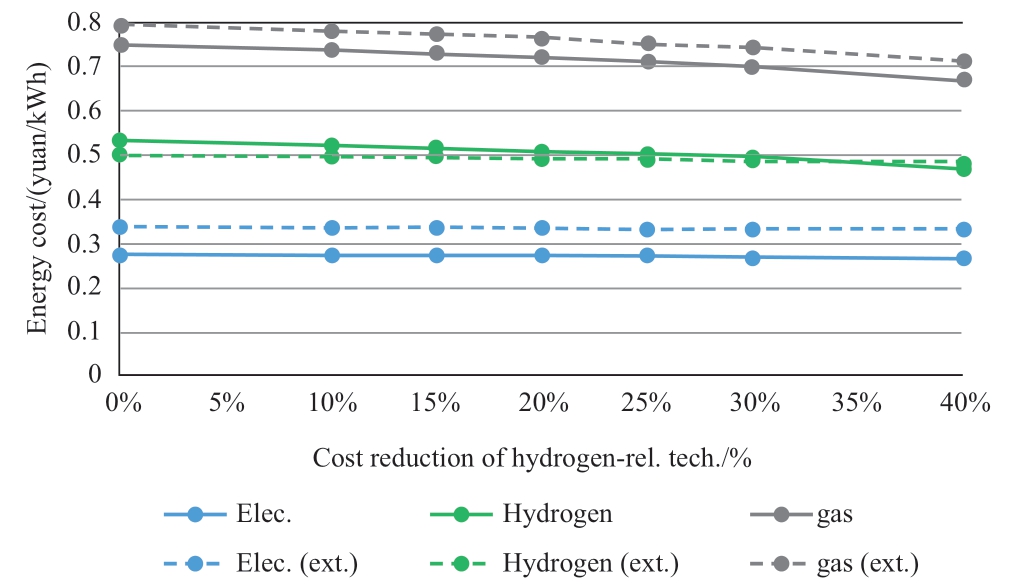
Fig.9 Production costs of electricity, hydrogen, and gas
4 Conclusion
In this study, we propose an electricity-hydrogen coupled model to realize the operation simulation and capacity planning optimization for the energy system.Based on this model, the hydrogen storage value for improving the system flexibility is quantitatively evaluated by performing optimization calculations in several cases.The results of the optimization are analyzed in terms of two dimensions: (1) horizontal comparison of the results between the two conditions of hydrogen storage enabled and disabled under a certain level of hydrogen and gas demand;(2) vertical comparison among the cases with different levels of hydrogen and gas demand from 0% to 16% of the total energy demand.
With respect to the first dimension, we find that enabling hydrogen storage leads to a remarkable reduction in the VRE curtailment and an overall drop in the energy cost,which lead to lower investment costs of VRE installation and battery capacity and an improved utilization rate of VRE.This proves that hydrogen storage complements battery storage to ease the energy demand imbalance,particularly over the long term.Flexibility in hydrogen storage impacts not only the hydrogen raw material but also the power system owing to the fuel-cell taking effect, except for the highest hydrogen demand level.With respect to the second dimension, we discover that the rise in hydrogen demand leads to high VRE and battery capacities in the absence of hydrogen storage; the converse holds when hydrogen storage is enabled.This indicates that with the increasing demand for hydrogen in the energy system, the hydrogen storage advantage further improves the flexibility of the system.Ultimately, this indicates that a cost reduction of approximately 20% in hydrogen-related technologies is required, leading the hydrogen storage to work as a longterm energy storage as well for the power system for high hydrogen demand.This study suggests that a region with large-scale VRE generation such as Northwest China should consider the development of a hydrogen storage industry in advance to reduce future social energy costs.
Appendix
Table 1 Cost of technologies

*Details presented in Table 3.
Table 2 Conversion and storage efficiency
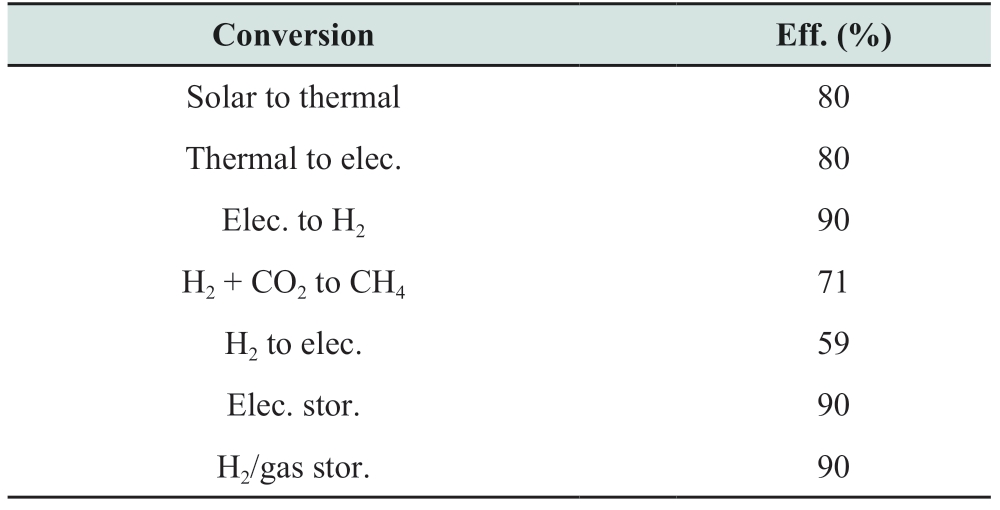
Table 3 Power transmission cost
Acknowledgement
This work was supported by National Natural Science Foundation of China (program number 51707108) and Global Energy Interconnection Group Co., Ltd.Science and Technology Project (2700/2020-75001B).
Declaration of Competing Interest
We declare that we have no conflict of interests.
References
[1] Ministry of Ecology and Environment of the people’s republic of China (2018) The People’s Republic of China Second Biennial Update Report on Climate Change, http://www.mee.gov.cn/ywgz/ydqhbh/wsqtkz/201907/P020190701765971866571.pdf.Accessed 12 Jul 2021
[2] Global Energy Interconnection Development and Cooperation Organization (2021) Carbon Neutrality Road of China, China electric power press, Beijing
[3] Steinberg M, Cheng HC (1989) Modern and prospective technologies for hydrogen production from fossil fuels.International Journal of Hydrogen Energy, 14(11): 797-820
[4] Nation Energy Administration (2019) Introduction to the gridconnected operation of renewable energy in 2018, http://www.nea.gov.cn/2019-01/28/c_137780519.htm.Accessed 15 Jul 2021
[5] Jiang H, Du E, Jin C, et al (2021) Optimal Planning of Multitime Scale Energy Storage Capacity of Cross-national Interconnected Power System with High Proportion of Clean Energy.Proceedings of the CSEE, doi: 10.13334/j.0258-8013.pcsee.201634
[6] Xiao JY, Hou JM, et al (2020) Quantitative Model and Case Study of Energy Storage Demand Supporting Clean Transformation of Electric Power System Automation of electric power systems, 1-11, http://kns.cnki.net/kcms/detail/32.1180.TP.20200720.1309.002.html.Accessed 30 Jul 2021
[7] Ren DW, Hou JM, et al (2021) The Exploration of Key Technologies for Energy Storage in the Clean Energy and Power Transition High Voltage Engineering.1-10.https://doi.org/10.13336/j.1003-6520.hve.20201056
[8] Li JQ, Chen J, Zhang W, et al (2019) Integrated Control Strategy for Battery Energy Storage Systems in Distribution Networks with High Photovoltaic Penetration.Transactions of China Electrotechnical Society, 34(2): 437-446
[9] Wang ZD, Chen J, Zhang BM, et al (2019) A Study on Life Cycle Economics of Wind Hydrogen-Mixed Energy Storage System.Power System and Clean Energy, 35(11): 66-73
[10] Shi T, Si XZ, Rao YF, et al(2019) Research on Flexibility Evaluation Method of Multi-Point Distributed Energy Storage System Considering Aggregation Effect.Power System and Clean Energy, 2019, 35(12): 67-73
[11] Luo Q, Zhang XY, Luo J, et al (2020) Allocation of Peak Storage and Valley Filling Capacity Based on Positive and Negative Benefits.Power System and Clean Energy, 36(2): 91-97
[12] Wang W, Li RQ, Zhang L, et al (2020) Comparative Analysis and Research on Optimal Operation of the Integrated Energy System Considering Multi-Type Electrical Storage.Power System and Clean Energy, 36(2): 110-116,123
[13] Li SX, Yue YL, Wu BQ (2020) Grid-Connected Micro Grid Energy Storage System Capacity Stochastic Planning Jointly Optimized with Demand Response.Power System and Clean Energy, 36(2): 124-130
[14] Jiao DD, Chen J, Fu JX, et al (2020) Configuration of Energy Storage Capacity for Suppressing Fluctuation of Wind Power.Power System and Clean Energy, 36(3): 66-73
[15] Li JL, Guo BQ, Niu M, et al (2018) Optimal Configuration Strategy of Energy Storage Capacity in Wind/PV/Storage Hybrid System.Transactions of China Electrotechnical Society, 33(6):1189-1196
[16] Feng X, Pan J, LeTang, et al (2003) Economic evaluation of transmission congestion relief based on power market simulations.2003 IEEE Power Engineering Society General Meeting (IEEE Cat.No.03CH37491).Toronto, ON, Canada.IEEE, 1018-1024
[17] Eto J H, Gallo G (2017) Regional Transmission Planning: A review of practices following FERC Order Nos.890 and 1000.Office of Scientific and Technical Information (OSTI)
[18] Doquet M, Fourment C, Roudergues J M (2011) Generation &transmission adequacy of large interconnected power systems:A contribution to the renewal of Monte-Carlo approaches.2011 IEEE Trondheim PowerTech, 1-6
[19] Sanchis G (2015) Europe’s future secure and sustainable electricity infrastructure: e-highway2050 project results.http: //www.e-highway2050.eu/fileadmin/documents/ehighway2050booklet.pdf.Accessed 02 Jan 2021
[20] Drayton G, McCoy M, Pereira M, et al (2004) Transmission expansion planning in the Western interconnection-the planning process and the analytical tools that will be needed to do the job.IEEE PES Power Systems Conference and Exposition, 2004.New York, NY, USA.IEEE, 1556-1561
[21] Deane J P, Drayton G, Ó Gallachόir B P (2014) The impact of sub-hourly modelling in power systems with significant levels of renewable generation.Applied Energy, 113: 152-158
[22] Du E S, Zhang N, Kang C Q, et al (2019) A high-efficiency network-constrained clustered unit commitment model for power system planning studies.IEEE Transactions on Power Systems,34(4): 2498-2508
[23]Sun HX, Li Z, Chen AH, et al (2019) Current Status and Development Trend of Hydrogen Production Technology by Wind Power.Transactions of China Electrotechnical Society,34(19): 4071-4083
[24] Fan YN, Bu GG, Tao XH, et al (2020) Research and Implementation of Power Grid Simulation Data Management Platform.Electric Power, 53(8): 60-68
[25] Sarrias-Mena R, Fernández-Ramírez L M, García-Vázquez C A,et al (2015) Electrolyzer models for hydrogen production from wind energy systems.International Journal of Hydrogen Energy,40(7): 2927-2938
[26] Hernández-Gόmez Á, Ramirez V, Guilbert D (2020) Investigation of PEM electrolyzer modeling: Electrical domain, efficiency, and specific energy consumption.International Journal of Hydrogen Energy, 45(29): 14625-14639
[27] Reuß M, Grube T, Robinius M, et al (2017) Seasonal storage and alternative carriers: A flexible hydrogen supply chain model.Applied Energy, 200: 290-302
[28] Nasri S, Sami B S, Cherif A (2016) Power management strategy for hybrid autonomous power system using hydrogen storage.International Journal of Hydrogen Energy, 41(2): 857-865
[29] Colbertaldo P, Agustin S B, Campanari S, et al (2019) Impact of hydrogen energy storage on California electric power system:Towards 100% renewable electricity.International Journal of Hydrogen Energy, 44(19): 9558-9576
[30] Li J R, Lin J, Zhang H C, et al (2020) Optimal investment of electrolyzers and seasonal storages in hydrogen supply chains incorporated with renewable electric networks.IEEE Transactions on Sustainable Energy, 11(3): 1773-1784
[31] Li L, Fan S, Chen Q, et al (2018) Hydrogen storage technology:Current status and prospects Energy storage science and technology.7(4): 586-594
[32] Power system operation simulation software (LPSP_ProS 2010)Wuhan: Huazhong University of Science and Technology, 2010
[33] Loulou R, Goldstein G, Noble k.(2004) Documentation for the MARKAL family of models.Energy Technology Systems Analysis Programme: 65-73
[34] IRENA (2018) Power system flexibility for the energy transition:Part 1 overview for policy makers.International Renewable Energy Agency, Abu Dhabi
[35] IRENA (2018) Power system flexibility for the energy transition:Part 2 IRENA FlexTool methodology.International Renewable Energy Agency, Abu Dhabi
[36] Marin A, Salmeron J (1998) Electric capacity expansion under uncertain demand: Decomposition approaches.IEEE Transactions on Power Systems, 13(2): 333-339
[37] Global Energy Interconnection Development and Cooperation Organization (2020) Development and Outlook on Renewable Energy Power Generation Technology.China power press,Beijing
[38] Deng YB, Huang RZ, et al (2018) New developments in fuel cells, The World of Power Supply, 000(005):41-45
[39] Global Energy Interconnection Development and Cooperation Organization, (2020) Development and Outlook of UHV Transmission Technology.China electric power press, Beijing
[40] Zhang J Q, Zheng H L, He W Y, et al (2020) West-east gas pipeline project.Frontiers of Engineering Management, 7(1):163-167
Received: March 9 2021 Accepted: July 9 2021 Published: August 25 2021
Chen Jin
chen-jin@geidco.org
Jinyu Xiao
jinyu-xiao@geidco.org
Jinming Hou
jinming-hou@geidco.org
Xiaoqing Wu
wuxiaoqingsdu@163.com
Jinxuan Zhang
jinxuan-zhang@geidco.org
Ershun Du
duershun@tsinghua.edu.cn
2096-5117/© 2021 Global Energy Interconnection Development and Cooperation Organization.Production and hosting by Elsevier B.V.on behalf of KeAi Communications Co., Ltd.This is an open access article under the CC BY-NC-ND license (http: //creativecommons.org/licenses/by-nc-nd/4.0/ ).
Biographies

Chen Jin received the M.Sc.degree in Photovoltaic Solar Energy from the Instituto de Energía Solar (IES), Universidad Politécnica de Madrid, Spain, in 2014, and Ph.D.degree in Electronic Engineering from the Universitat Politècnica de Catalunya, Barcelona, Spain, in 2018.

Jinyu Xiao received his Ph.D.degree in Electrical Engineering from Tsinghua University, in 2005.He is working in GEIDCO, Beijing.His research interests include electrical system planning and new clean energy technologies.

Jinming Hou received his bachelor’s degree in Electrical Engineering from the North China Electric Power University in 2002 and his Master’s degree in Electrical Engineering from North China Electric Power University in 2006.His research interests include power system and automation.

Xiaoqing Wu received B.S.degrees from Northwest A&F University, Yangling, China,in 2018.She is currently a graduate student with Shandong University.Her research interests include Chemical energy storage,hydrogen storage, power system planning.

Jinxuan Zhang received Ph.D.degree in Chemistry from Peking University, Beijing,China, in 2019.

Ershun Du received B.S.and Ph.D.degrees from Tsinghua University, Beijing, China, in 2013 and 2018, respectively.He is currently a Research Assistant Professor with Tsinghua University.His research interests include lowcarbon energy policy, renewable energy, power system planning.
(Editor Dawei Wang)
