1 Introduction
In view of the continuous growth of the wind power access capacity,the fluctuation and randomness of the generated output power will introduce new challenges to the dispatching, planning, and safe and stable operation of power systems.Therefore,approaches needed to reduce the negative impact of grid-connected wind power on the power system have become a research hotspot.One of the effective ways to solve the aforementioned adverse effects is to analyze the wind power fluctuation characteristics (WPFC) and accurately establish its probability distribution model.This approach may also provide more safe and economical decision-making means for dispatch and planning agencies [1–3].
At present, scholars have conducted extensive research on WPFC modeling [4–9].In [4], the author defined three quantitative indicators based on the measured wind power output data, and analyzed WPFC from the aspects of the differential time scale and installed wind farm capacity.As the research progressed, some researchers began to use a mixed distribution of multiple functions as the prior distribution of wind power fluctuations.In [5], the author proposed a method of fitting WPFC with a Gaussian mixture model instead of a single distribution function model based on the measured data of a wind farm group.In [6], the author analyzed a large number of measured data of wind farm output, and used various probability distribution models to simulate the WPFC of wind farms.In [7], the authors proposed a hybrid t location–scale distribution model to describe the probability distribution of WPFC.In [8], the authors proposed a probability distribution model of a finite mixed Laplace distribution based on a large number of measured wind farm data.In [9], the authors proposed a hybrid Logistic distribution model to quantitatively describe WPFC, and validated it with measured data from a wind farm.Overall, prior publications used the theoretical distributions of one or more functions to fit the distribution curve of the wind power fluctuation index as the prior distribution, and then used historical data to estimate its parameters.Nevertheless,the universal applicability of the constructed model has been proven difficult to guarantee.Wind farms in China are extensively distributed throughout the country.Additionally, the WPFC in different regions may follow different forms of probability densities, and the modeling method based on parameter estimation is difficult to guarantee its universal applicability.
In view of this,some studies have proposed the modeling of WPFC with nonparametric estimation [10–14].Compared with the parameter estimation method,this method directly builds a probabilistic model based on historical sample data,and does not need to make a prior judgment on the standard form of wind power fluctuation.Therefore,it is of great advantage to use nonparametric kernel density estimation (NPKDE) methods when it is not clear which standard parameter form the probability density of the wind power fluctuations will have.In [10], the authors first applied a statistical approach and the method of NPKDE to construct a distribution function of wind power prediction errors.Based on this, they established a benefit model based on wind farm wind energy loss and energy storage device planning considerations.In [11],the authors predicted the wind power based on the actual power curve, and then combined the distribution characteristics of the prediction errors to predict the error distribution characteristics using NPKDE.In [14], the authors first used the hybrid Copula function to characterize the correlations between multiple failure modes.Based on these, they constructed the corresponding probability density function and cumulative distribution function based on the NPKDE method.However, if NPKDE was used to model the WPFC, problems still persisted.Accordingly, the bandwidth is the only parameter that needs to be determined in the NPKDE model.Traditional NPKDE often uses the same bandwidth for all samples in a model.However,owing to the large wind power samples, different samples may be adapted to different bandwidths.Using only one bandwidth will lead to a low-degree of fitness at a certain point or in a certain interval of the sample, which is the problem of so-called low-local fitness.
In summary,this study first uses the moving average method to extract the wind power fluctuations.It then uses an improved NPKDE method to model the extracted results.Subsequently, a constraint-order optimization algorithm is used to solve the model.The main research and innovation aspects of this study are as follows: 1.an improved NPKDE strategy is proposed, whereby the geometric distance is used as an index to identify the sample interval with a lower fitting accuracy, and its bandwidth is modified; 2.a method is proposed to model WPFC based on NPKDE.The advantages are: 1.the fixed, single bandwidth becomes adaptively adjusted by the sample interval, and the variable bandwidth improves the modeling accuracy of NPKDE; 2.the probability characteristics of the wind power fluctuation are modeled directly based on sample data, and there is no need to judge which standard distribution form it obeys.Therefore, it has higher accuracy and applicability.Finally, simulation results based on actual data obtained from a wind farm in Hubei have verified the correctness and effectiveness of the proposed modeling method.
2 Extraction of wind power fluctuation based on the method of moving average
Wind power contains continuous and minute components [15–17].The continuous components undergo smaller fluctuations, exhibit longer fluctuation periods, and have minor influences on the stability of the power system and the accuracy of wind power forecasting.However,the minute component is characterized by a large fluctuation and a short-fluctuation period.When the installed capacity of wind power is large,the component will seriously affect the power quality of the power system.At present, the lowpass filters,wavelet decomposition,and empirical mode decomposition,are used to extract the momentum of the wind power wave.However,these methods cannot use the time scale of the data to decompose the signal.In addition,some problems are associated with these methods, such as the boundary effect [18–20].
Therefore, according to the basic concept of the algorithm for the separation of load components in [21],this study uses the method of moving average to eliminate the wind power fluctuation.First, a time window is selected with a specific length,and the arithmetic average of all the values within the window is estimated.The value of the center point of the window is then replaced with the estimated average value.Finally, the window is moved backward by the dot pitch.The aforementioned steps are repeated.Suppose the length of the moving average is K min.If K is an even number, then the minute component PHt and continuous component PLt of the wind power at time t are calculated using (1).

where PLt is the continuous component,PHt is the minute component,which is the amount of change superimposed on the continuous component,Pt is the measured average power at t min,t is the measurement point,and Jis the total number of measurement points.
The length K of the moving time window is randomly selected,and its selection directly affects the extracted fluctuation components.If it is too long,the change trend of wind power will be reflected on the minute component PHt, and the minute component will no longer be a random variable.If it is too short, the fluctuation of wind power will be reflected on the continuous component PLt.In general,this can be selected according to experience, that is, 20 min is more suitable for general loads, and 30 min is suitable for large impact loads.Combined with the actual situation, this study selected the period of 20 min as the moving average sampling period [22].
3 Modeling of wind power fluctuation probability density based on improved NPKDE
3.1 Wind power fluctuation probability density model based on NPKDE
It is assumed that x1,x2,...,xn is an n-sample sequence denoting the wind power fluctuation.If (,) x b is the probability density function of wind power fluctuation, then the NPKDE of this probability density function is estimated as,

where xi represents the sample data of wind power fluctuation at the ith sampling point,b is the bandwidth, and  is the kernel function.
To ensure the continuity of the estimated probability density function, the kernel function needs to be a symmetric smooth nonnegative function to meet the following characteristics,
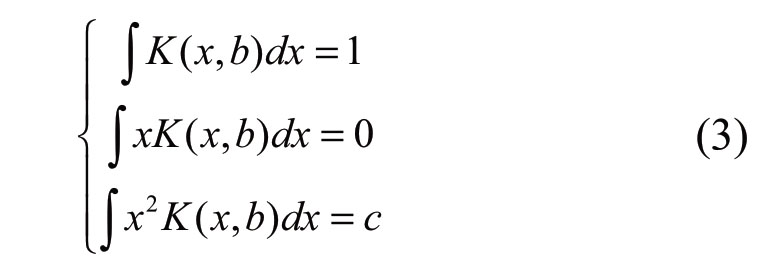
where c is a constant.
There are many kernel function choices.However,different kernel functions have little impact on accuracy [23–25].Therefore,the kernel function selected in this study is a commonly used Gaussian function formulated as,

Combination of (2) and (4) allows the formulation of the nonparametric kernel density estimation of the wind power probability density function as,

To evaluate the goodness-of-fit of the model, three evaluation indices are used as the valid evaluation indices of the model,namely the correlation coefficient r,root mean square error (RMSE), and mean absolute error (MAE).The smaller the RMSE and MAE are, the more accurate the model will be.The closer the correlation coefficient value is to unity, the better the model fit is [26, 27].
The model deviation (geometric distance) can be calculated as,
where i =1,2,..., m,where m is the number of groupings of the wind power fluctuation sample frequency histogram,![]() is the ordinate of the ith histogram,and
is the ordinate of the ith histogram,and ![]() is the function value of the fitted probability density function.
is the function value of the fitted probability density function.
The three evaluation indicators are defined as follows,
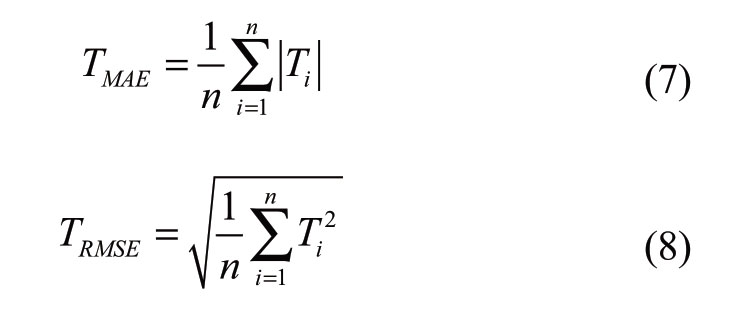

where n is the number of sample sequences, and![]() is the average value of the ordinate values of the histogram.
is the average value of the ordinate values of the histogram.
3.2 Model improvement strategy
As indicated in (5), the existing NPKDE theory uses a fixed bandwidth b. Thus,only one b is obtained to estimate the minimum sum of fitness of all the data samples.This processing method may be associated with the situation in which the evaluation index is abnormally large for individual sample data.If the bandwidth b corresponding to the sample data is modified in a targeted manner,the adaptive bandwidth can be solved.Therefore, changing the originally fixed bandwidth yields a set of adaptive bandwidth vectors that can ensure the local adaptive characteristics of the constructed probability model, and further improves the model’s goodness-of-fit.Therefore, on the basis of the aforementioned NPKDE method, the following improvement strategies are added.After the use of the bandwidth optimization model to obtain the optimal bandwidth bZ, the applicability of sample spacing is discriminated.For any sample interval ![]()
![]() if the following inequality is satisfied, there will be local adaptability problems in the sample interval.
if the following inequality is satisfied, there will be local adaptability problems in the sample interval.
where Tl(bz) is the model deviation in any sample interval l,![]() is the average model deviation of the entire sample space,and λ is the adjustment coefficient.The specific value of λ can be determined according to the actual test situation.
is the average model deviation of the entire sample space,and λ is the adjustment coefficient.The specific value of λ can be determined according to the actual test situation.
The mathematical expression of the mean geometrical distance ![]() is,
is,
For the interval of the local adaptability problem, the bandwidth adjustment model is constructed and the bandwidth matrix is modified to
where bl is the bandwidth of the l sample interval,nlis the number of samples in the sample interval, T(bz)mid is the median of the geometric distance in the sample interval,and δ is the kernel function threshold.Therefore, (5) can be modified in the following form, and an adaptive NPKDE model for the model is thus proposed,

where
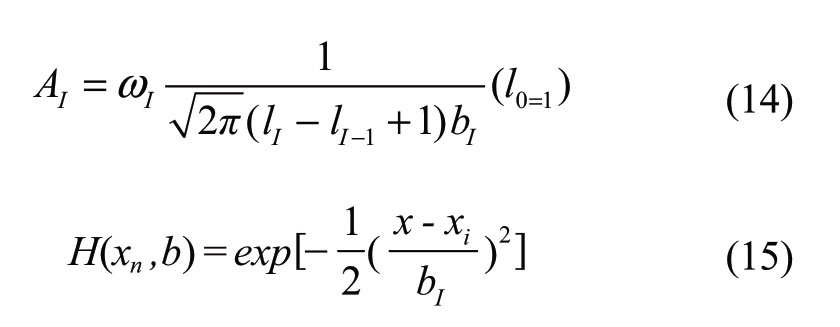
In (xx) the number of sampling intervals to be adjusted is k,and bI is the modified bandwidth matrix of the interval I.
3.3 Bandwidth optimization model
In the NPKDE model, the selection of bandwidth bis important for kernel density estimation [28].In this study,the test of fitness is used as a constraint condition,and is incorporated into the bandwidth optimization model.A constrained bandwidth optimization model is proposed as follows

where (•) Xise is the integrated mean-square-error, R(x,b) is the true probability density function that takes the ordinate value of the frequency histogram,2 bχ is the test statistics of the NPKDE 2χ,and ![]() is the 2χdistribution with m-1 degrees-of-freedom at the significant level α.
is the 2χdistribution with m-1 degrees-of-freedom at the significant level α.
4 Solution of bandwidth optimization model based on constrained-order optimization
The sequential optimization method is an effective method used to solve complex optimization problems [29–30].Traditional sequential optimization is generally used for unconstrained optimization problems.In this study, there are constraints in the bandwidth optimization model.Therefore, this study uses constrained sequential optimization based on the following steps:
Step 1: Determine the solution space Ω of the bandwidth value
Step 2: According to (3) and bandwidth value, calculate the wind power wave of the nonparametric kernel density estimation function value for momentum
Step 3: According to (17), calculate the number of solutions in the observation solution set

where (•)Prob is the alignment probability, Θ is a sufficiently good solution set,g is the number of real solutions,p is the number of solutions in the observed solution set P.Additionally, sshows that there are at least struths,η shows the probability that the observation solution set P contains s sufficiently good solutions,and qis the probability that an adjective solution is actually observed in the solution space
Step 4: Select the 2χ test as the approximate model,and find the p solutions that satisfy it in Ω to form the observation solution set P
Step 5: Select the objective function of (16) as the exact model,and use the exact model to compare the solutions in the solution set P in order; then select the first s solutions to be true solutions
Step 6: Use (7)–(9) as the criterion, selecting the optimal solution bz, and then use (10)–(12) to modify the bandwidth to obtain the final optimal bandwidth sequence.
5 Data analyses
According to the measured data of a wind power field in Hubei Province, the simulation experiment was programmed in MATLAB.
5.1 Extraction of wind power volatility
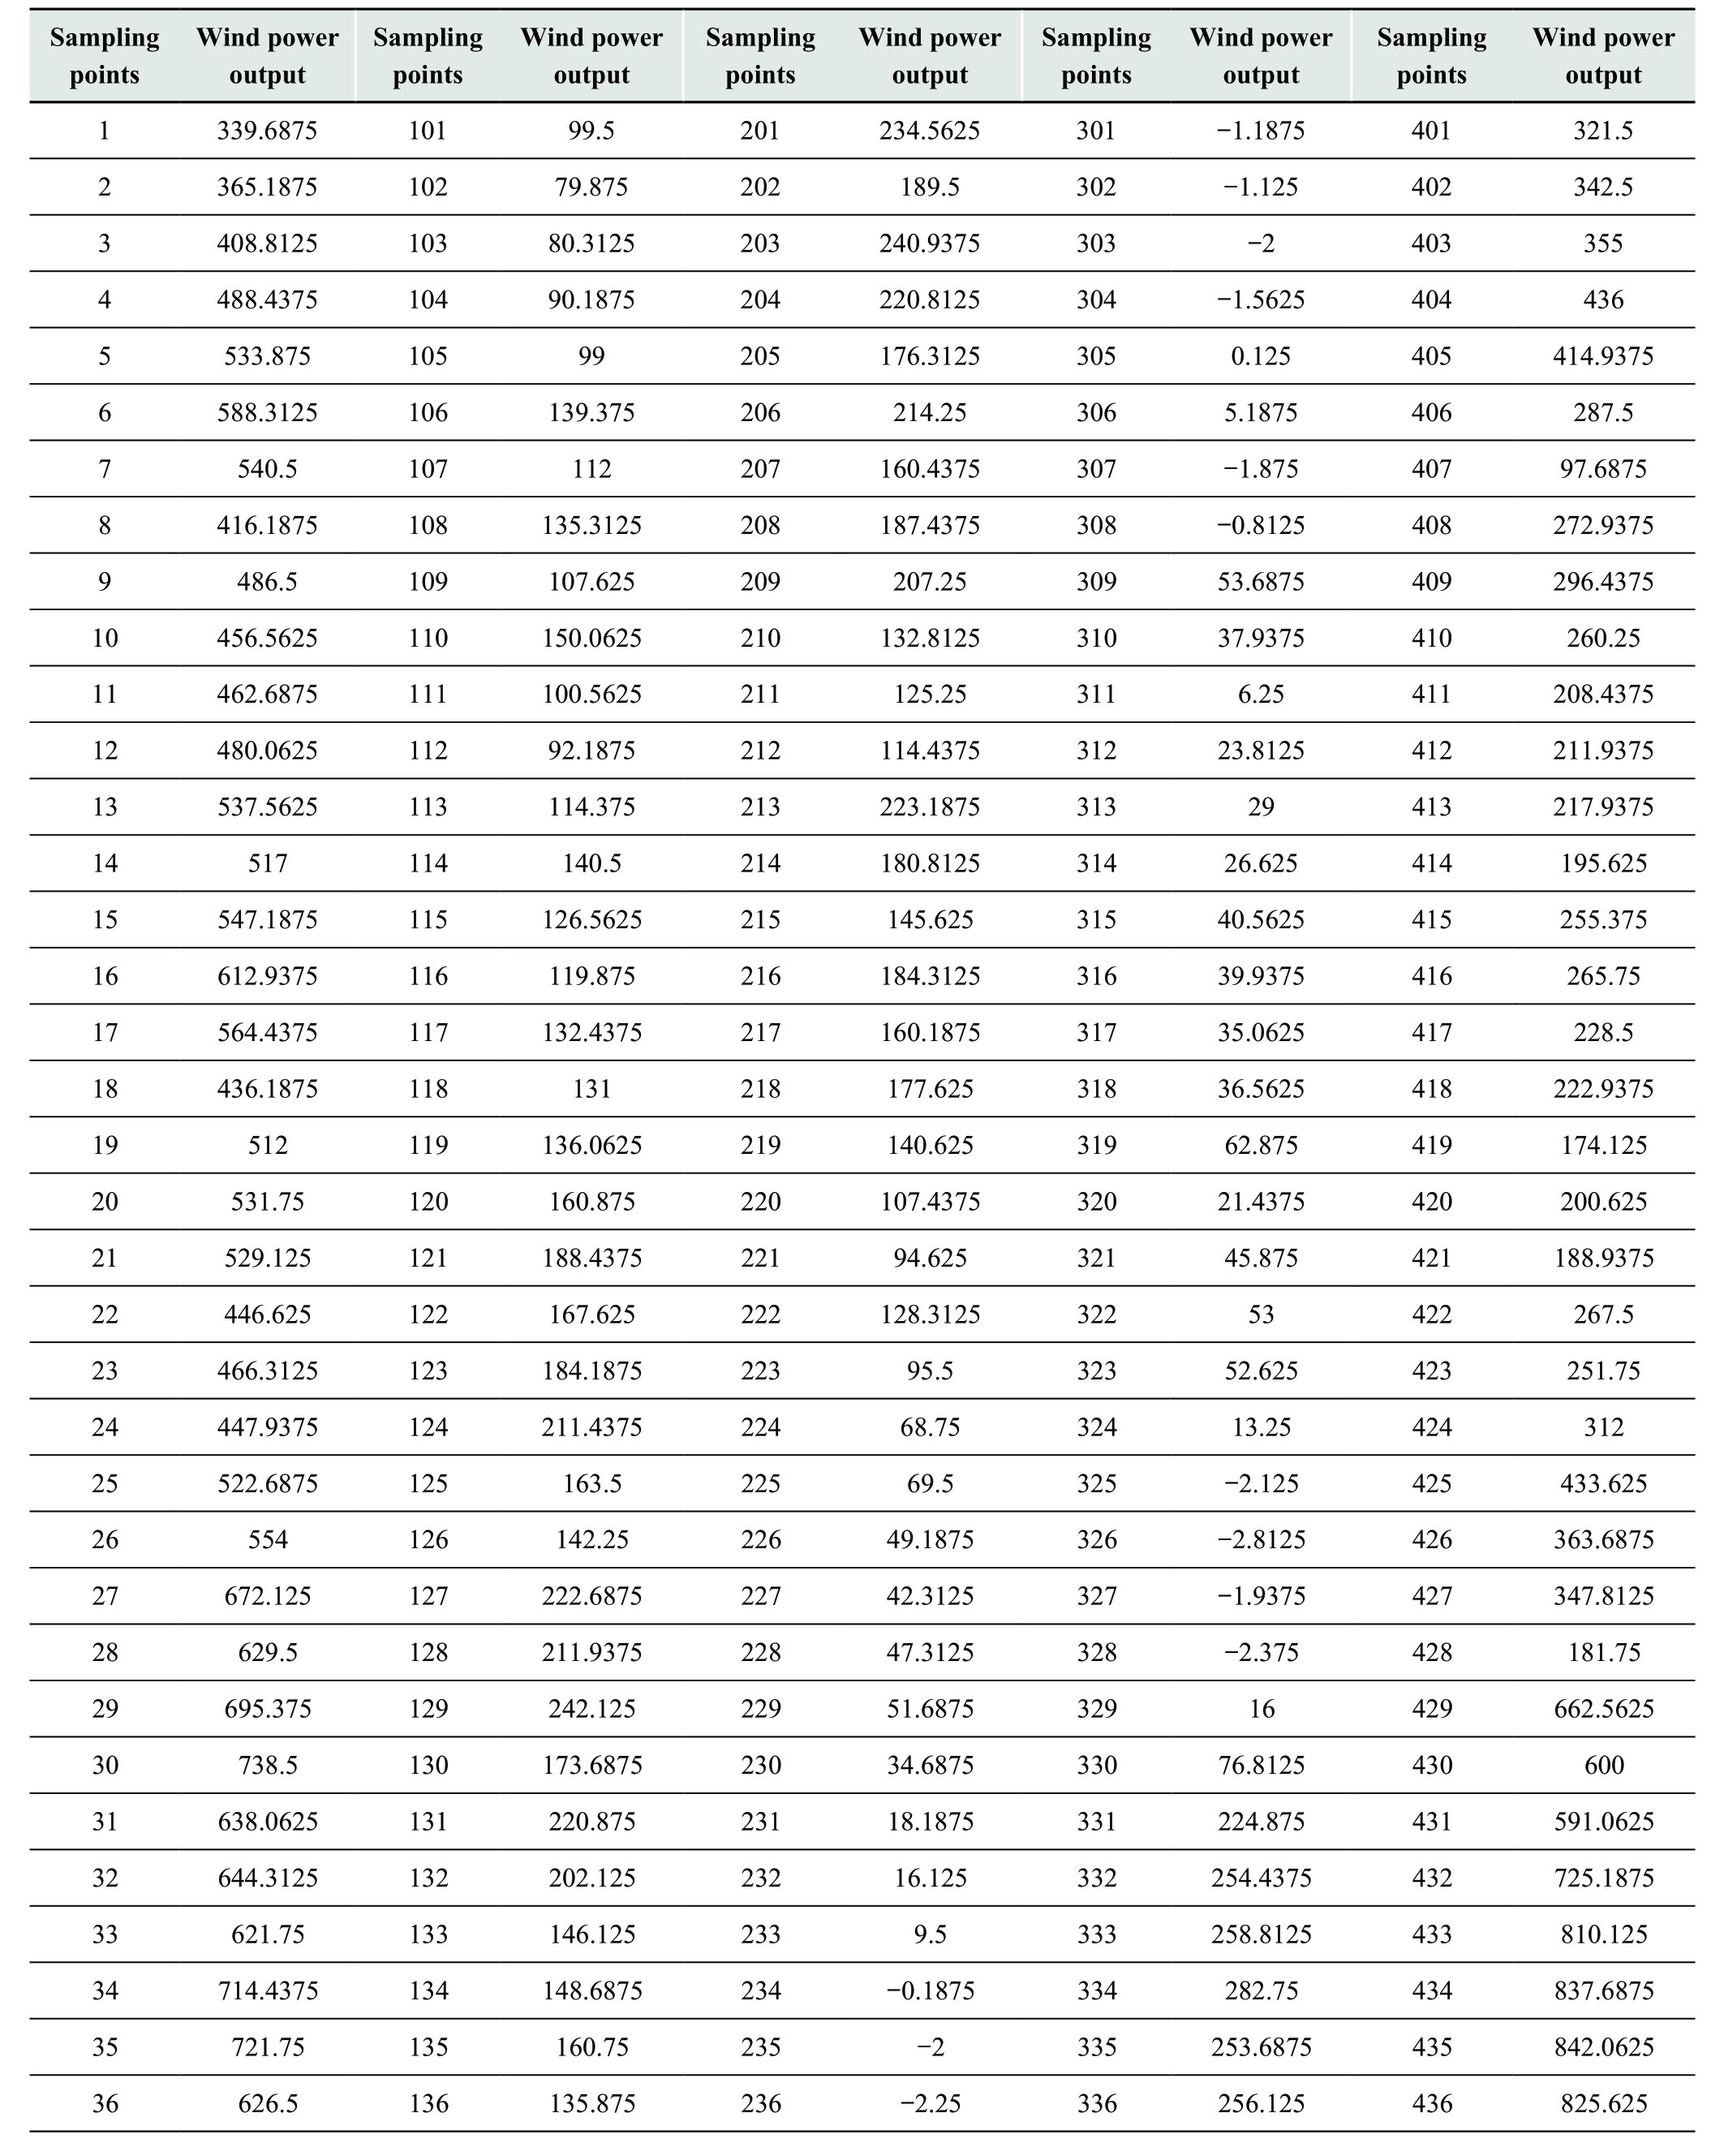
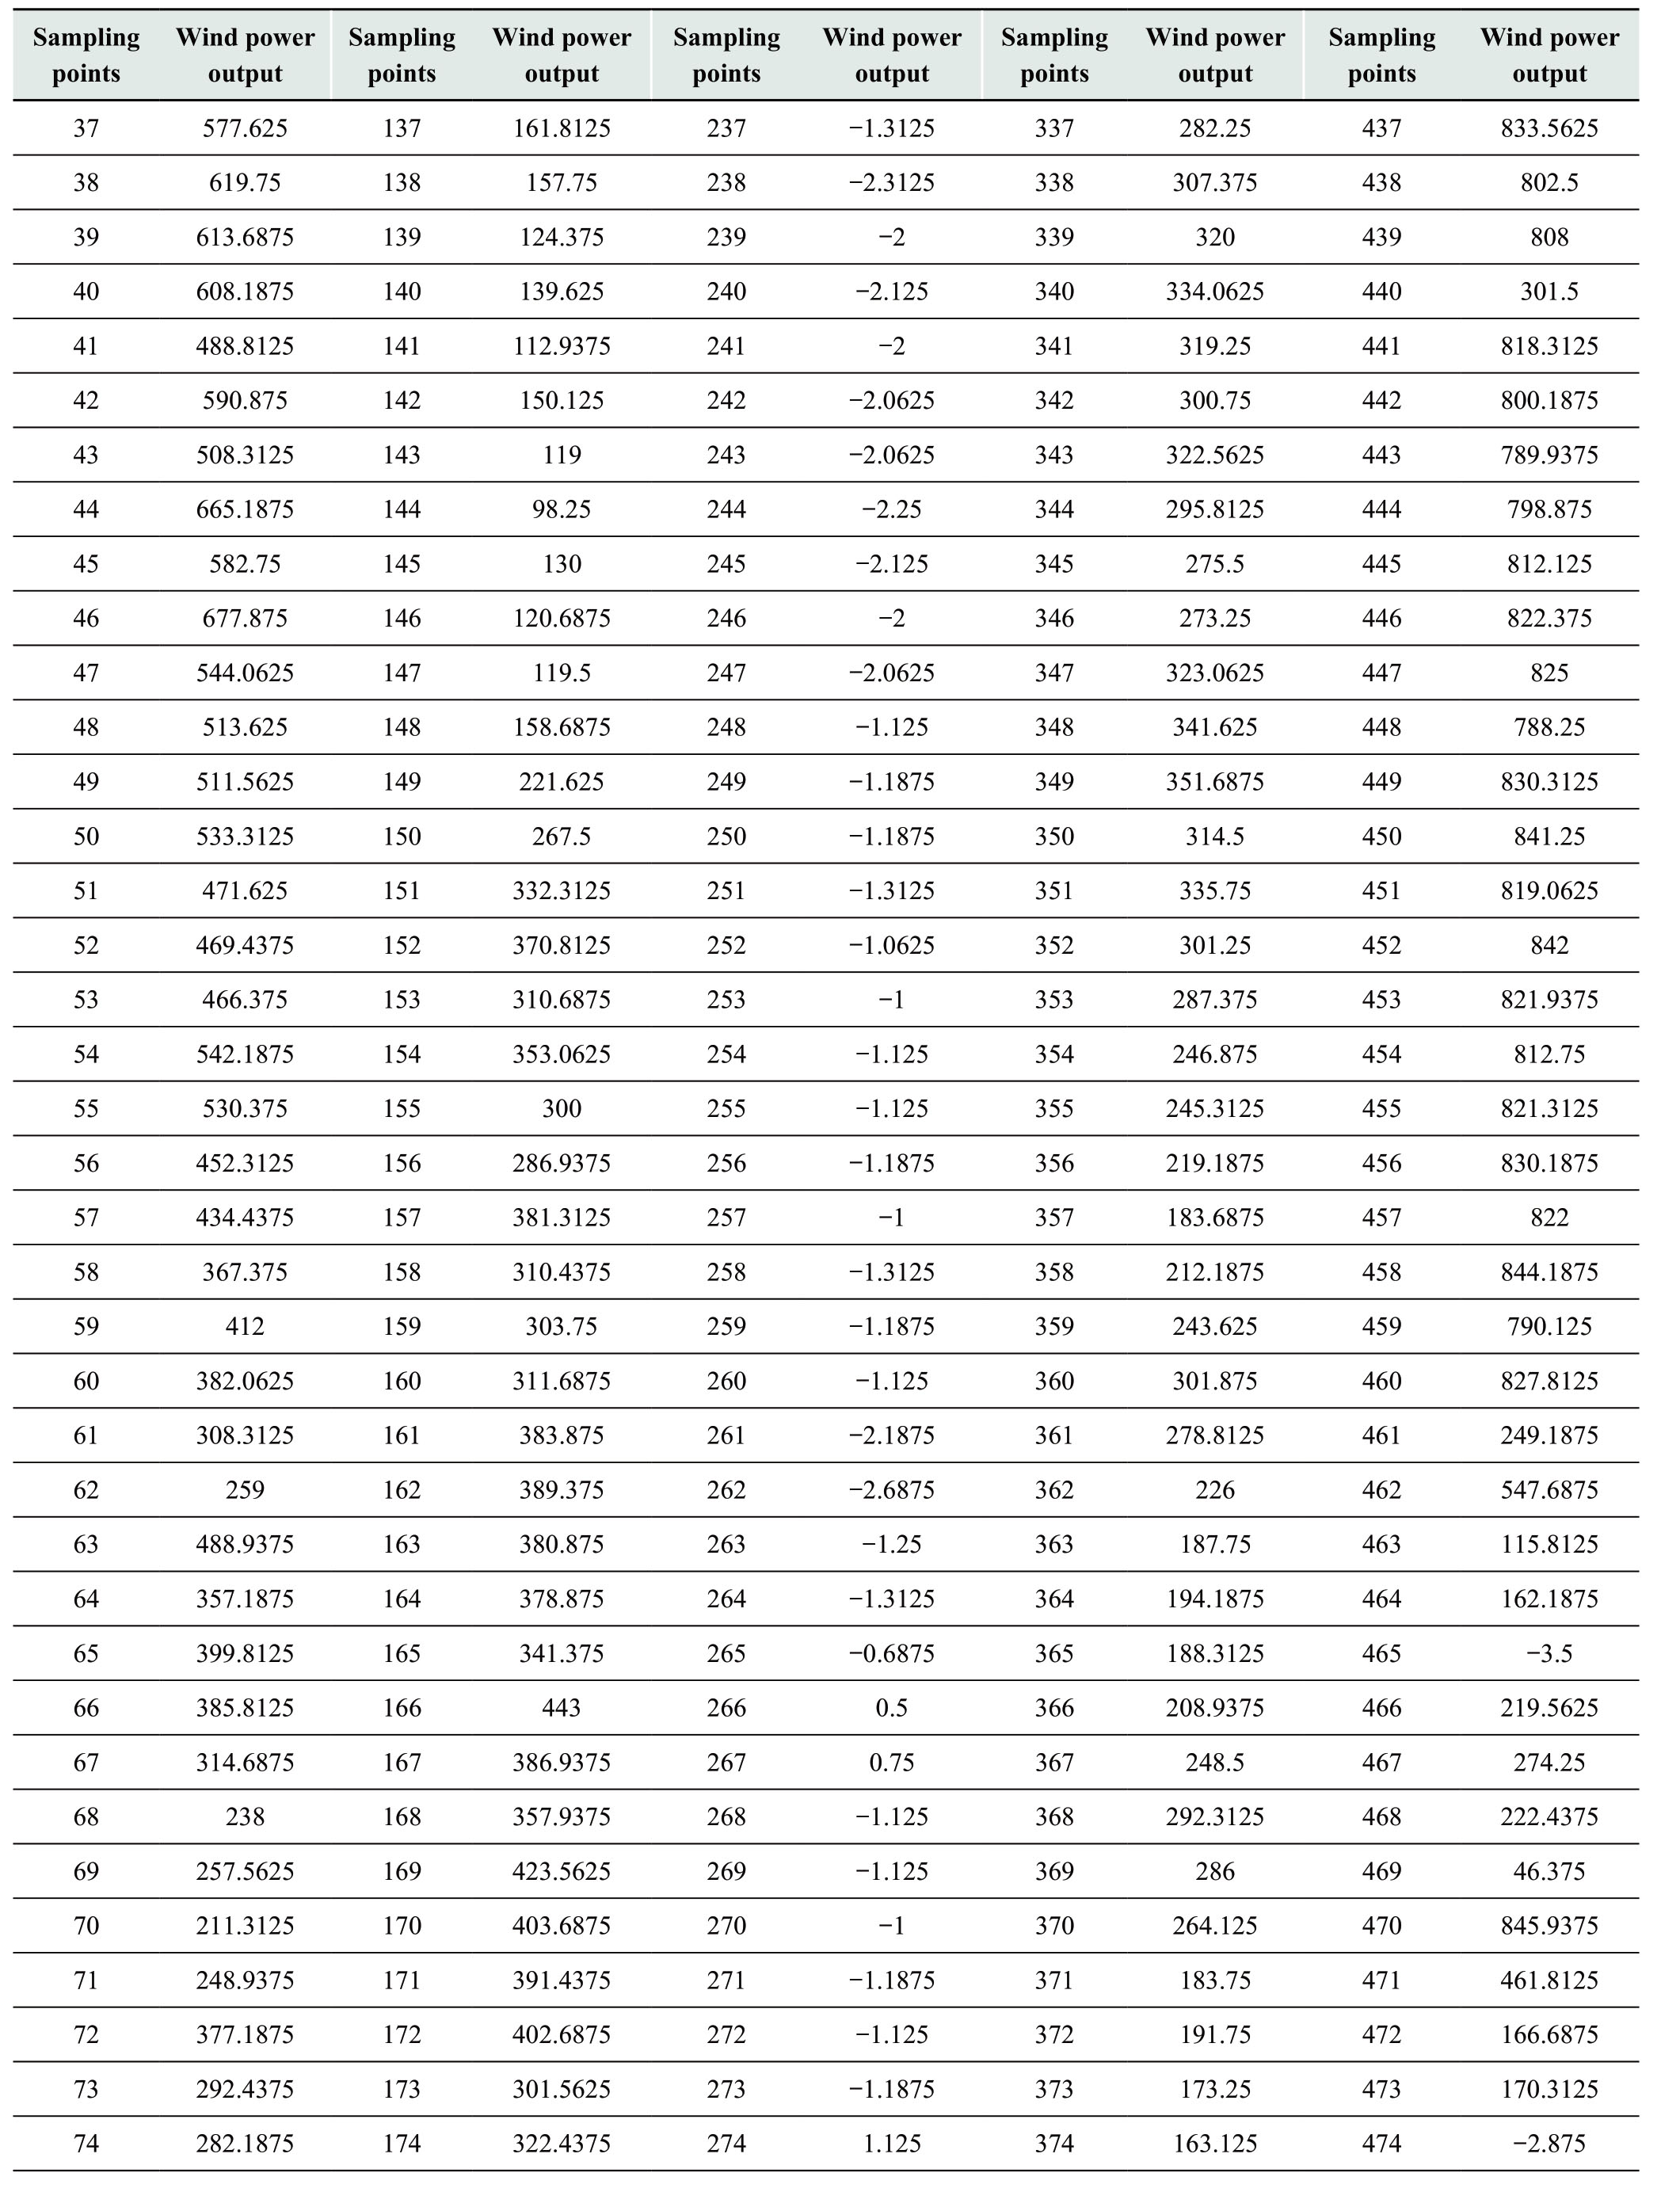
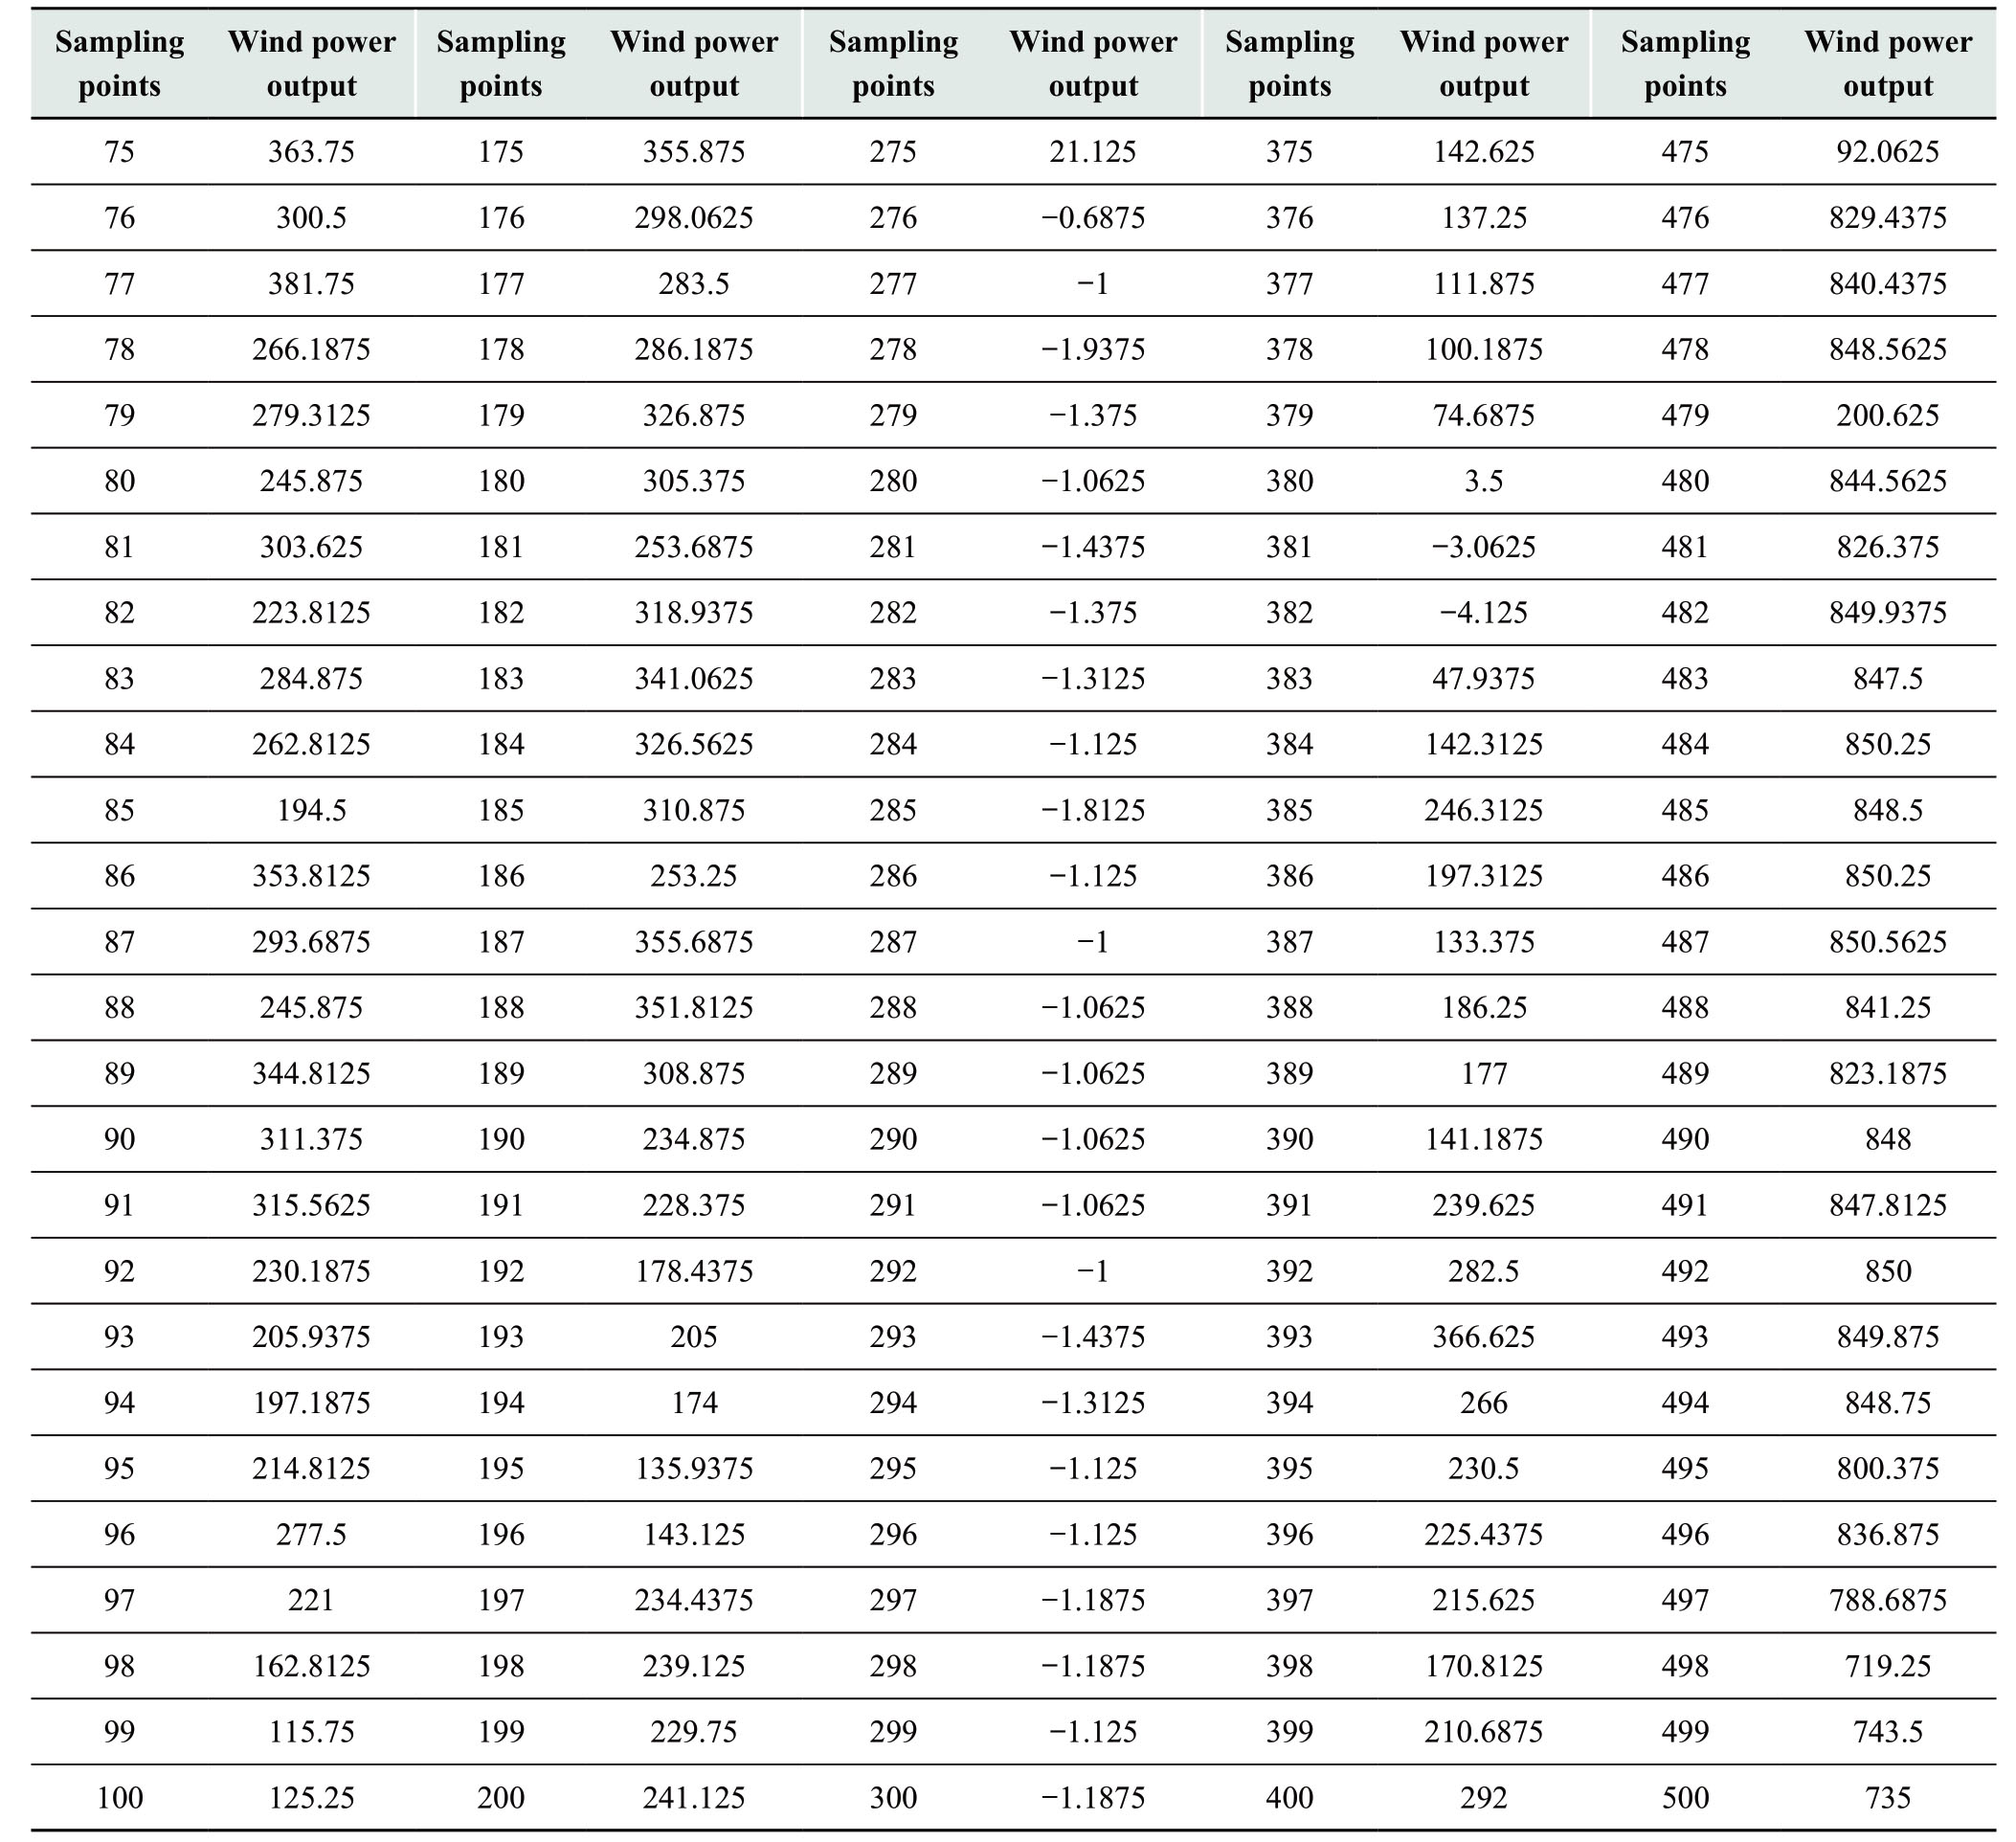
From March 17 to April 19, 2009, 500 active output data were selected for analysis.The detailed wind power output data are shown in Appendix A.The sampling period of the data was 10 min and the wind farm consisted of 16 wind turbines rated at 850 kW.The moving average method was used to process the data of the first fan in this study,and the output comparison before and after processing is shown in Fig.1.
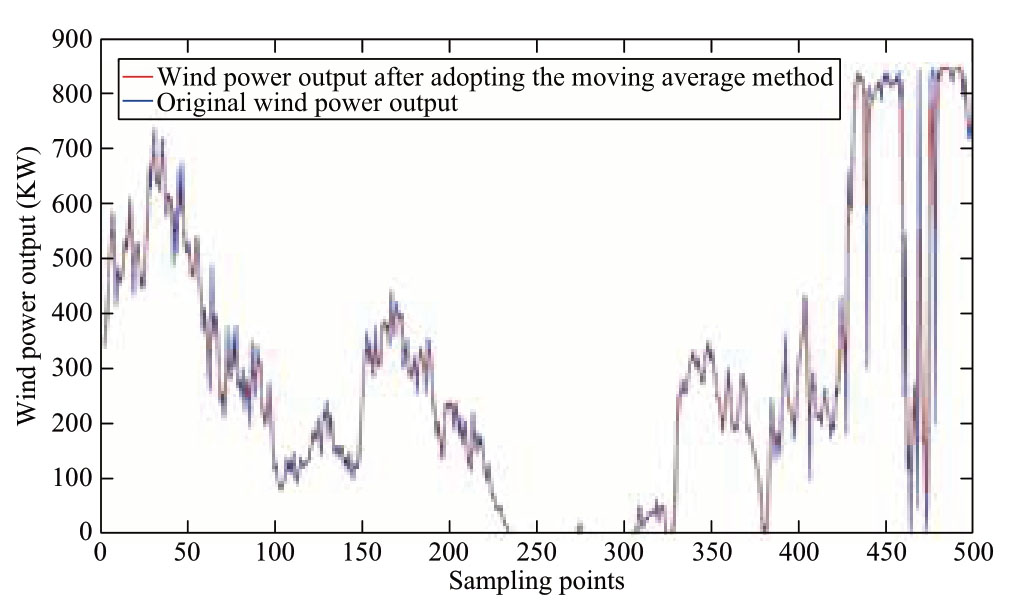
Fig.1 Comparison of wind power sampled sequences
Fig.1 shows that the moving average method can set a time window for the sampled data and estimate the local average.Furthermore, the fluctuating random error is filtered out,and the random fluctuation of wind power output is effectively reduced so as to obtain a smoother output result.The comparison of wind power fluctuation is shown in Fig.2.
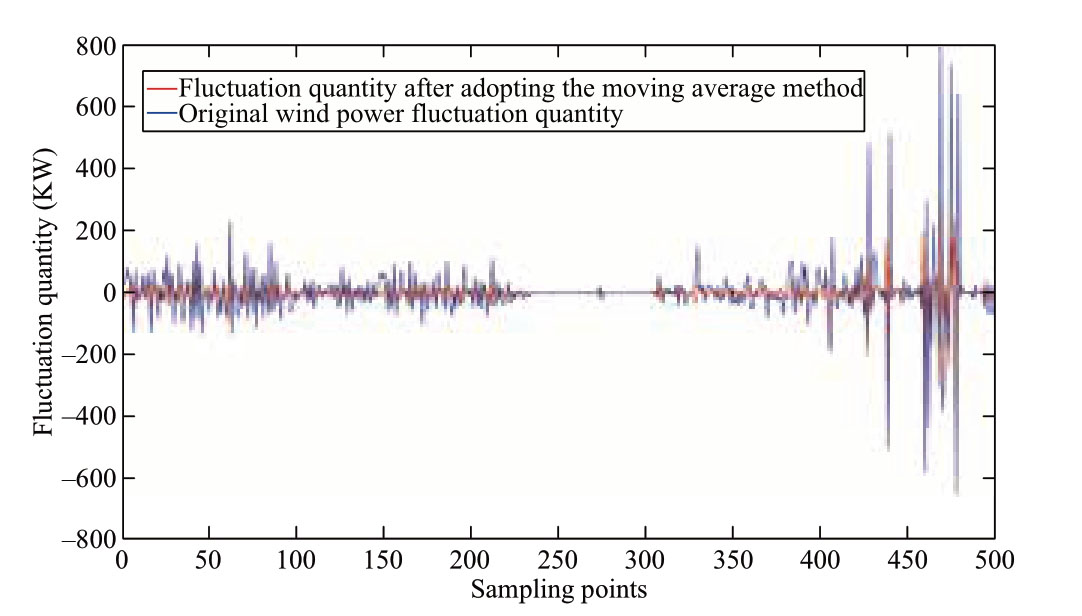
Fig.2 Comparison of wind power fluctuations
Fig.2 shows that the fluctuation of wind power output can be slowed down after the method of moving average is used.The wave momentum shows a smooth variational trend to effectively reduce the impact of wind power fluctuation on the accuracy of model construction.
5.2 Comparative analysis
5.2.1 Comparison of the results of NPKDE before and after improvement
The probabilistic density model of the wind power fluctuation component is established for the wind power volatility quantity extracted in this study.Compared with the simulation results of the traditional NPKDE method, the effectiveness of the improved modeling strategy proposed in this study is verified.By analyzing the MAE, RMSE, the three r indices,the fitting degree of the model was evaluated.The probability density curve is shown in Fig.3.The results of the error operation are listed in Table1.
Table1 Comparison of evaluation indices before and after the improvement of the probability density model
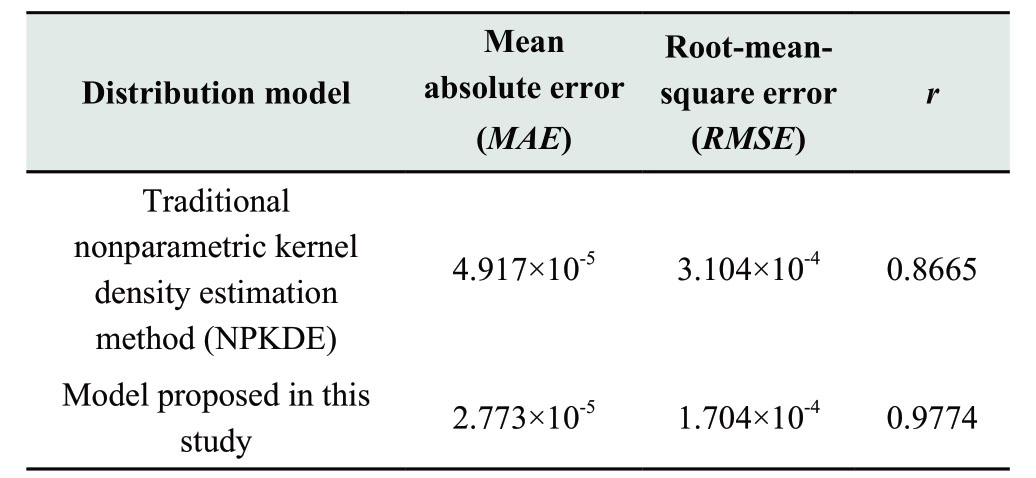
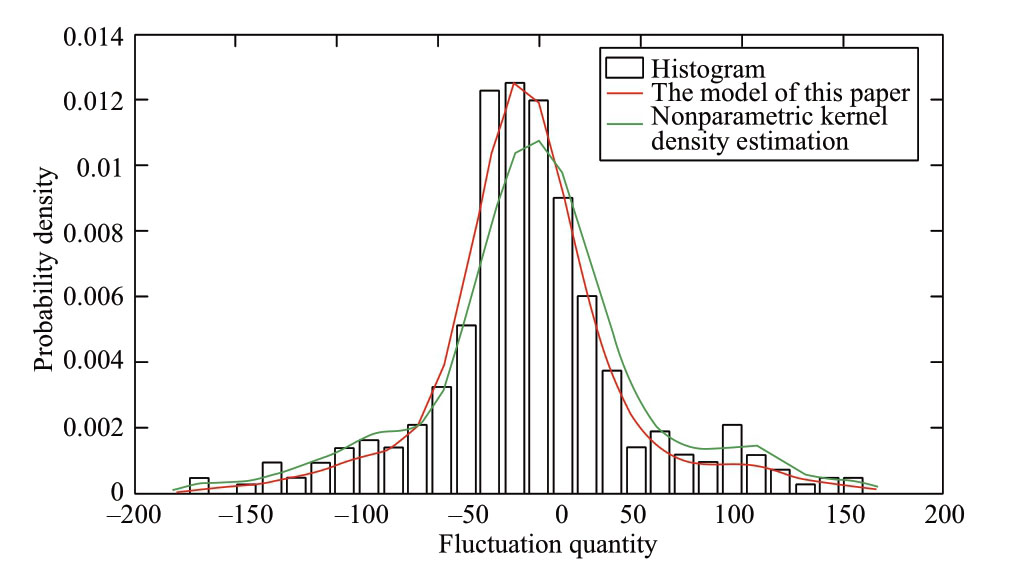
Fig.3 Comparison of goodness-of-fit before and after the improvement of the NPKDE method
By analyzing the results of Fig.3 and Table1, it can be found that the method used in this study is better than the traditional NPKDE method.The MAE, RMSE, and r values of the model are reduced by 43.6%, 45.1%, and improved by 12.8%, compared with the traditional model, respectively.The reason is attributed to the fact that the traditional NPKDE method is designed to minimize the total error of the entire sample and obtain a fixed bandwidth value.
The method of this study not only focuses on the sum of errors, but also modifies the bandwidth of the local intervals where the error is large.Although it is possible to reduce the accuracy of some individual intervals,the accuracies of the sample intervals with the largest errors have been improved considerably.Thus, the overall modeling accuracy has been increased by this method (as shown in Table1, the improved nonparametric correlation coefficient is much better than the traditional nonparametric correlation coefficient,and is close to unity).It can be observed that the overall modeling accuracy of the multivariable NPKDE method can be improved effectively by the adaptive adjustment of the bandwidth of the sample intervals with local adaptive problems.
5.2.2 Precision and fitness comparison between the parameter estimation method of the mixed distribution function and the adaptive NPKDE
The precision and fitness of wind power volatility of the proposed method is verified by using the parameter estimation method and the modeling method based on mixed logistic,mixed t location–scale,and mixed Gaussian distributions, respectively.The sampled data represent the active power data of the entire wind farm,and the studied time period was from March 17, 2015, to April 19, 2015.The sampling period was 10 min.The comparison results of the precision and fitness of different model evaluation indicators are listed in Table2.The comparison curve of precision for probability density is shown in Fig.4, and the fitness comparison curve is shown in Fig.5.
Table2 Comparison of the precision and fitness of different model evaluation indicators

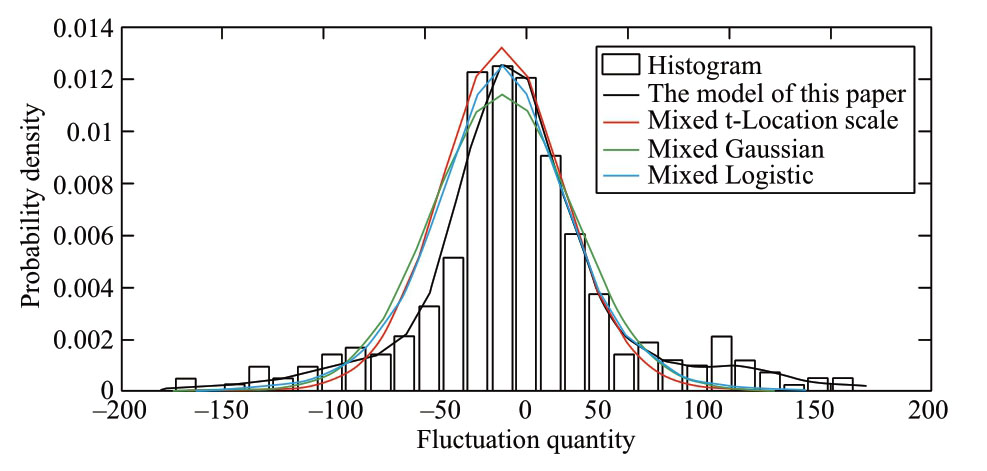
Fig.4 Comparison of the precisions of different model evaluation indicators
From Fig.4 and Table2, it can be observed that among the four probability distributions of wind farm power fluctuation, the model in this study has the best fit, and the three indices are all the best.The r values of the mixed Gaussian and mixed logistic distributions were only 0.9631 and 0.9332.It can be observed that if the prior distribution selection was erroneous, the parameter estimation method could not easily obtain a better modeling accuracy.Although the correlation coefficient of the mixed t-location distribution was close to the model in this study, its MAE increased by 59.7%, and the RMSE increased by 53.9% compared with the model proposed in this study.Based on the analysis of the results, it can be concluded that the improved NPKDE method has a higher modeling accuracy than the mixed parameter estimation method.The main reason is that the method is driven by sample data to directly model the probability distribution.It is not necessary to select the distribution function form of the sample distribution in advance,while the modeling precision does not depend on the selection result of the distribution function that is only related to the bandwidth selection.
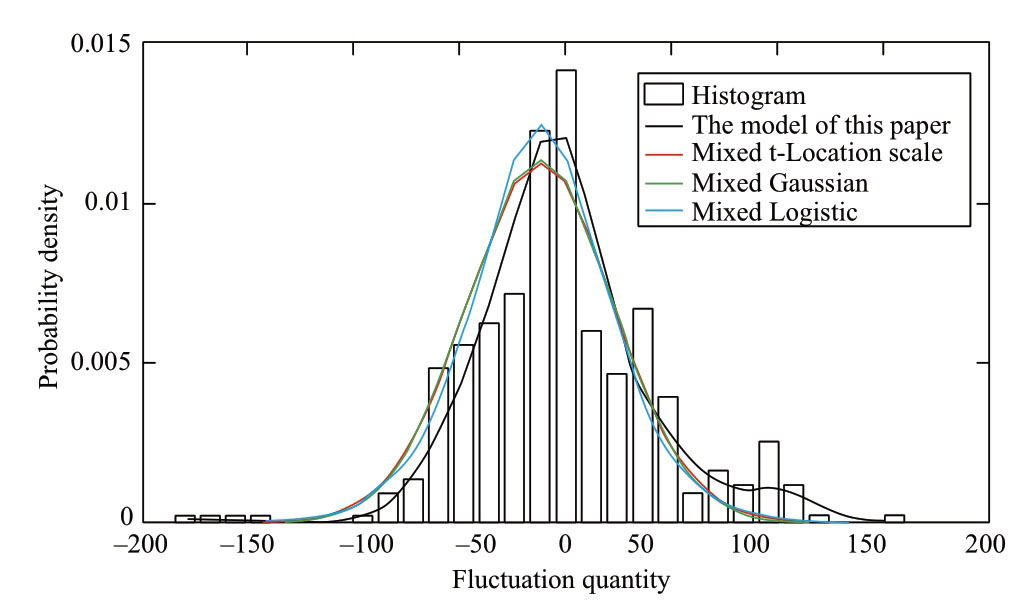
Fig.5 Comparison of the fitness values of different model evaluation indicators
Fig.5 and Table2 show that the model in this study yielded the best fitting effect among the four probability distributions of wind power volatility, and its rvalue was 0.9954.However, the modeling accuracy of the mixed t location–scale,the mixed Gaussian,and the mixed logistic distributions, were much lower, and their r values were only 0.9534, 0.9687, and 0.9295, respectively.Therefore, the improved NPKDE method proposed in this study is more applicable than the mixed parameter estimation method.The main reason is that the parameter estimation method needs to determine the form of probability distribution function in advance, but the probability distribution of different wind farms may follow different forms.Thus,the parameter estimation of different wind farms with the same distribution function may reduce the goodness-of-fit of the model.Therefore,the method proposed in this study can ensure the precision and fitness of modeling.
5.2.3 Comparison of Operation Time in Constructing Different Models
To test the calculation efficiency of the model constructed in this study,the calculation times of different models were compared,and the specific results are listed in Table3.
Table3 Comparison of operation times in the construction of different models
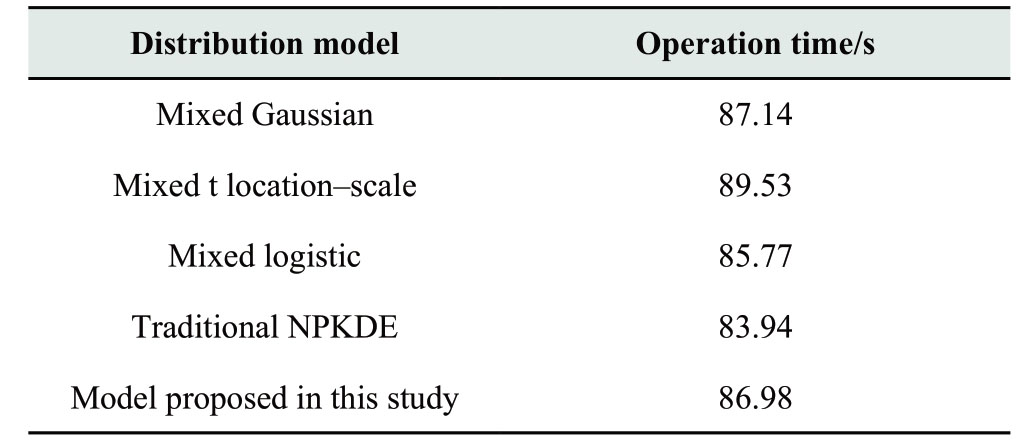
Table3 shows that the operation time of the model constructed by the method in this study has not been increased considerably when the modeling accuracy and the overall goodness-of-fit was improved.Compared with the traditional NPKDE method with the shortest operation time, the operation time of this method was only increased by 3.04 s.It can be concluded that the method in this study improves the modeling accuracy and goodness-of-fit, but with the improvement of modeling accuracy and goodness-of-fit, the operation time of the model did not increase significantly.These findings conform to the actual requirements of the modeling process.
6 Conclusions
A wind power fluctuation modeling method was proposed in this study based on the method of moving average and adaptive NPKDE.To improve the precision of the constructed model of this study,an algorithm was used to solve it based on constraint ordinal optimization.The specific conclusions are as follows:
(1) The method of moving average can reduce the random wind power output fluctuations in this study so as to effectively reduce the impact of these fluctuations on the accuracy of the constructed model
(2) The improved NPKDE method proposed in this study can solve the problem of large interval errors of local samples.Based on the bandwidth correction strategy, multiple adaptive bandwidths can replace the single, fixed bandwidth of traditional NPKDE, and can improve the goodness-of-fit of the NPKDE method
(3) Compared with the traditional modeling method based on parameter estimation, the improved NPKDE based on modeling method is more accurate and applicable.
Appendix A
Table Wind power fluctuation at various sampling points
continue
continue
Acknowledgements
This work was supported by Science and Technology project of the State Grid Corporation of China “Research on Active Development Planning Technology and Comprehensive Benefit Analysis Method for Regional Smart Grid Comprehensive Demonstration Zone,” and National Natural Science Foundation of China (51607104).
References
[1]Yao J.G, Yang S.C, Wang K, et al.(2014) Framework and strategy design of demand response scheduling for balancing wind power fluctuation.Automation of Electric Power Systems, 38(9): 85-92
[2]Huang K.Y, Huang Y.C (2004) Integrating direct load control with interruptible load management to provide instantaneous reserves for ancillary services.IEEE Transactions on Power Systems, 19(3):1626-1634
[3]P.Mukherjee, V.V.Rao (2020) Effective location of SMES for power fluctuation mitigation of grid connected doubly fed induction generator, Journal of Energy Storage, 29
[4]Wan S.T, Wan J (2015) Research on wind power fluctuation characteristics based on quantitative index and probability density distribution.Acta Energiae Solaris Sinica, 36(02): 362-368
[5]Cui Y, Yang H.W, Li H.B (2016) Probability density distribution function of wind power fluctuation of a wind farm group based on the gaussian mixture model.Power System Technology,40(04): 1107-1112
[6]Lin H, Sun L.C, Chang X.Q (2014) A probabilistic model to simulate wind power output fluctuation of a certain wind farm cluster in Xinjiang region.Power System Technology, 38(06): 1616-1620
[7]Yang M, Dong J.C (2016) Study on characteristics of wind power fluctuation based on mixed distribution model.Proceedings of the CSEE, 36(S1): 69-78
[8]Zhou T.H, Chen L, Li J (2017) Wind power fluctuation characteristic analysis based on finite Laplace mixture model.Power System Technology, 41(02): 543-550
[9]Yang M, Ma J, Li C.F (2017) A mixed logistic distribution model for wind power fluctuation characteristics.Power System Technology, 41(5): 1376-1382
[10]Ye R.L, Guo Z.Z, Liu R.Y, et al (2014) A method for designing optimal energy storage system based on analysis of wind power forecast error.Automation of Electric Power Systems, 38(16): 28-34
[11]Zhou S.L, Mao M.Q, Su Jian.H (2011) Short-term forecasting of wind power and N on-parametric confidence interval Estimation.Proceedings of the CSEE, 31(25): 10-16
[12]Sun J.B, Wu X.S, Zhang B.H (2013) Wind Power interval prediction based on non-parametric kernel density estimation.Water Resources and Power, 31(9): 233-235
[13]Yang N, Cui J.Z, Zhou Z (2016) Research on nonparametric kernel density estimation for modeling of wind power probability characteristics based on fuzzy ordinal optimization.Power System Technology, 40(02): 335-340
[14]Sun Y.T, Luo L.F, Zhang Q, Qin X.R (2019) Reliability analysis of stochastic structure with multi-failure modes based on mixed Copula.Engineering Failure Analysis, 105: 930-944
[15]Feng J.X, Liang J, Feng Y.K (2015) Optimized calculation of wind farm energy storage capacity based on the fluctuation characteristics of min power component of wind power.Power System Protection and Control, 43(03): 1-6
[16]Lu P.M, Wen B.Y (2014) Study on static voltage stability of hydraulic wind power integrated with power grid.Power System and Clean Energy, 30(05): 85-91
[17]Li L, Liu T.Q, Chen Z.H, et al (2015) Ultra-short-term wind power forecasting based on EEMD and ARCH.Electrical Measurement & Instrumentation, 52(18): 16-21
[18]Zhan Z.Q, Fu J.X.(2019) Research on coordinated control of energy management of wind-storage combined system with smooth wind power.Sichuan Electric Power Technology, 42 (05): 29-36
[19]Wang X.L, Li Hui (2012) Multiscale prediction of wind speed and output power for the wind farm.Journal of Control Theory and Applications, 10(2): 251-258
[20]Yan G.G, Xiong H, Yang M (2013) Study on real-time cooperative prediction based on wavelet theory for wind power.Journal Of Northeast Dianli University, 33(Z1): 120-125
[21]Wang D.X (2004) Analysis of AGC regulation demand in power system operation.Automation of Electric Power Systems, (08): 6-9
[22]Ma S.L, Jiang X.P, Ma H.M, et al.(2014) Capacity allocation of hybrid energy storage system to suppress wind power fluctuations.Power System Protection and Control, 42(08): 108-114
[23]Epanechnikov V A (1969) Nonparametric estimation of a multidimensional probability density.Theory of Probability and Its Application, (14): 156-161
[24]An Z.W, Xin Y (2015) Sensitivity analysis of reliability of gear in wind turbine gear-box based on important sampling method.Journal of Lanzhou University of Technology, 41(3): 36-40
[25]James W.Taylor, Jooyoung Jeon (2015) Forecasting wind power quantiles using conditional kernel estimation.Renewable Energy, 80
[26]Yadav Dhyan Chandra, Pal Saurabh (2019) To generate an ensemble model for women thyroid prediction using data mining techniques.Asian Pacific journal of cancer prevention : APJCP, 20(4): 1275-1281
[27]Fanelli Andrea, Vonberg Frederick W, LaRovere Kerri L, et al.(2019) Fully automated, real-time, calibration-free, continuous noninvasive estimation of intracranial pressure in children.Journal of neurosurgery.Pediatrics,1-11
[28]Boscolo Riccardo, Pan Hong, Roychowdhury Vwani P (2004) Independent component analysis based on nonparametric density estimation.IEEE Transactions on Neural Networks, 15(1): 55-65
[29]Ho Y.C, Sreenivas R S, Vakili P (1992) Ordinal optimization of discrete event dynamic systems.Theory and Applications, 2(2): 61-88
[30]Lina Reichenberg, Filip Johnsson, Mikael Odenberger (2014) Dampening variations in wind power generation—the effect of optimizing geographic location of generating sites.Wind Energy, 17(11): 1631-1643
Biographies

Peizhe Xin received his Master’s degree at the University of Electronic Science and Technology,China.He is working at the State Grid Beijing Institute of Economics and Technology.His research interests include intelligent power grid and power communication network planning.

Ying Liu received her Master’s degree at the North China Electric Power University.She is working at the State Grid Beijing Institute of Economics and Technology Her research interests include Power system analysis and control,smart grid evaluation and design.

Nan Yang received his Ph.D.degree at the Wuhan University.He is working in the Department of Hubei Provincial Collaborative Innovation Center for New Energy Microgrid, China Three Gorges University.His research interests include power system operation and control, power system unit combination, artificial intelligence and big data, and power system planning.

Xuankun Song received her Bachelor’s degree at the North China Electric Power University.She is working at the State Grid Beijing Institute of Economics and Technology.Her research interests include power system analysis and control,and smart grid evaluation and design.

Yu Huang received his Master’s degree at the China Three Gorges University.His research interests include intelligent power grid and power communication network planning.
(Editor Zhou Zhou)
