1 Introduction
The distribution network fault location methods can be roughly divided into the impedance method and the travelling wave method [1] based on the Feeder Terminal Unit (FTU) method [2] and the voltage sag information during the fault process method [3].The traditionally based FTU method uses the FTU method as the information source to transform the fault location problem into an optimization problem [4-8].However, these methods use only one information source for the fault location and the fault tolerance rates are low when the information is unreported or misreported.With the development of the Internet of Things (IoT), power customers and grid enterprises share data, which improves the ubiquitous connectivity between the grid and the customers.Full service unified data centers make it possible to take customer electric information acquisition system (CEIAS) as a redundant information source for the fault location to improve the fault location tolerance.At the same time, promoting clean energy absorption has become an important part of the construction to power the IoT.Therefore, the impact of distributed generations (DGs) on the distribution network fault flow must be considered in the fault location [10-12].
Some studies have proposed methods to improve the fault tolerance rate of the fault location.Based on three information sources, which includes the distribution network fault indicator, the distribution alarm, and telephone complaints, different network tree graphs are established according to the characteristics of the information sources.The preliminary fault location is carried out by searching network tree graphs and information fusion is carried out by using improved Dempster/Shafer evidence theory (D-S evidence theory) [13].In a previous study [14], a radial basis function neural network is established to estimate the equivalent reactance of the short circuit.The FTU fault information and the equivalent reactance of the short circuit are used as characteristic quantities to build an improved BP neural network (back propagation neural network) fault section location model.Although the reliability of the fault information is considered as a reference [13-14], only a single power supply in the distribution network is considered.In order to improve the fault tolerance of the fault location model, a previous study [15] takes the missing and false information of the nodes and the state of line sections as the characteristic variables of the fault location model.This leads to the excessive dimensions of variables and may lead to poor convergence of the method.
To solve the above problems, this paper proposes a fault location method based on multi-source information for the distribution network by considering the influence of the distributed generation.First, based on the data sharing platform, CEIAS is used as a redundant information source.Then, considering the influence of DGs on the fault location algorithm and the characteristics of the different information sources, fitness functions reflecting the difference between the actual received fault information and the expected fault information are constructed.Finally, D-S evidence theory is used for evidence fusion.Considering that the existence of abnormal fault information may lead to conflicts between the evidence and inaccurate fusion results, the fusion process is improved.The FTU method is configured in each line section of the distribution network; however, the customer area of the distribution network is relatively small and CEIAS has a lower penetration rate compared with the FTU method.The convergence to multiple solutions should be considered; therefore, the final fault location conclusion should be made by using decision criteria.
2 Fault location model
2.1 Fault location model using FTU information
When the DG is connected to the distribution network as a power supply, a short-circuit fault occurs at a certain point of the distribution network.The DG also provides a part of the short-circuit current.The fault overcurrent information can be obtained by setting an FTU reporting threshold to distinguish the short-circuit current from the working current [16].However, due to the DG’s access, power flow in the distribution network is no longer one-directional.The solid arrow shown in Fig.1 is the flow direction of the short-circuit current when the system is short-circuited between the phases.Therefore, assuming that the direction from the system power to the feeder of the distribution network is positive, the overcurrent information detected at the switch j is encoded as [17].


Fig.1 Distribution network with the DG
When a single-phase ground fault occurs in the distribution network, the fault current is not obvious and the FTU method cannot directly detect it.However, a zerosequence variable is generated when a single-phase ground fault occurs.The FTU method has a function of detecting a zero-sequence current and the zero-sequence component can be used to encode the switch state.The dotted arrow in Fig.1 represents the zero-sequence current flow; the zerosequence current information detected at switch j is encoded as follows [16]:

Considering the influence of the DG on the fault current, the system is divided into two parts.By taking switch j as a breakpoint, the part that includes the system power is the upper half area.The other part is the lower half area, and the switching function can be constructed as [17]:

where “Σ” represents the logical “OR” operation; Ks1、and Ks2 are the access factors.These denote whether the generations in the upper and lower half areas of switch j are connected to the system.If the power is connected to the system, the value is 1; otherwise it is 0.In addition, xj,s1 and xj,s2 represent the line state values from switch j to the upper half area power S1 and the lower half area power S2, respectively.When the line section fails, the state value takes on the value of 1; otherwise, the value is 0.In addition, xj(m) and xj(n) respectively indicate the line section state values in the upper and lower half areas of switch j.Finally, M and N are the total number of line sections in the upper and lower half areas of switch j, respectively.
2.2 Fault location model using CEIAS information
CEIAS can collect, process, and monitor power consumption information of the customers.CEIAS can achieve the automatic collection of electricity consumption information as well as measurement anomaly detection, power quality detection, electricity consumption analysis and management, relevant information release, distributed energy monitoring, and perform information interaction functions for the intelligent electricity equipment [18].Therefore, real-time customer information collected by CEIAS can be used to determine the real-time power supply situation for the customer’s location.This is also another source of information for the fault location.
After the DG is connected to the distribution network, the customer’s power supply is no longer just the system power.Therefore, it is necessary to distinguish the power supply of the region when determining whether the power supply situation of the customer area is normal.If protection devices work normally, the power supply situation of customer j is:
When the power supply situation of customer j is normal, the value of (x) is 0; otherwise it is 1.Sj represents the power supply of customer j; N represents the line section number of the minimum path from the power supply to customer j.In addition, xj(n) represents the line section state of the minimum path from the power supply to customer j.
2.3 Evidence fusion model
This paper uses D-S evidence theory for information fusion.The D-S evidence theory was first proposed by Dempster in 1967 to solve the multi-valued mapping problem by using upper-bound and lower-bound probabilities [19].This was also further extended by Shafer [20].All possible results of a problem are represented by set Θ, which is called the recognition framework and contains finite mutually exclusive propositions, i.e.Θ = {A1, A2, …, Ap}.For the set Θ probability assignment function m, this should satisfy:

where Ai is a focal element of m.
For the two pieces of evidence obtained from the two information sources in this paper, their basic probability distribution functions are m1 and m2, respectively, and they are independent of each other.They can be fused as follows:

where k is the conflict coefficient for the evidence.When k is 1, the contradiction formula of the evidence cannot be used.
However, due to the omission and error of the fault information, the evidence obtained from the abnormal information may conflict with the evidence obtained from no-abnormal information.When the degree of conflict between the evidence is large, the results of the fusion according to the above rules may be inconsistent with the actual situation.The reason of conflict between the evidence is that there is no intersection between the focal elements of the evidence.Since a complete set Θ has an intersection with all of the focal elements, the complete set Θ is added to the evidence body.In addition, the probability distribution density of the original focal elements in the evidence body are multiplied by the same discount rate u (u<1):

Since the information collected by the FTU method may be missing or may contain misinformation, it has a low reliability; therefore, u1 is 0.6.However, the call measurement information of CEIAS is relatively accurate and reliable; therefore, u2 is 0.8.
2.4 Evidence decision criteria
As mentioned above, the power supply information from CEIAS is introduced as a redundant information source.Although the accuracy of the fault location is improved, there is less power supply information.Thus, it is easy to converge to multiple optimal solutions when using it to locate faults.In summary, the final decision results are determined by improving the evidence decision criteria.
· When both information sources converge to only one optimal solution for the fault location, the focal element with the highest probability density after evidence fusion is directly selected as the final decision result.
· When the fault location result converges to multiple optimal solutions by using power supply information for CEIAS, the evidence fusion result satisfying the following conditions is selected.Afterwards, the focal element with the highest probability density after evidence fusion is considered to be the final result.
· Minimum k value: k indicates the degree of the contradiction between the evidence.The smaller the value of k, the smaller the degree of conflict between the evidence.Therefore, we had to choose the case with the smallest k.
· Maximum difference of the probability density: After evidence fusion, the difference in the probability densities between the first focal element and the second focal element according to the decreasing order of the probability density is calculated.The bigger the difference, the higher the support degree of the focal element with the highest probability density.For this reason, the case with the greatest difference was chosen.
· The maximum probability density of the focal element is greater than the complete set.
3 Model solving algorithm
Particle Swarm optimization (PSO) is a Swarm intelligence evolution algorithm which simulates the predation behavior of birds.In each iteration, each particle seeks a feasible solution according to the position vector and the velocity vector.The position vector and the velocity vector of the particle are updated according to their own individual optimal solution and the group optimal solution.PSO is characterized by many factors such as less control parameters, random search capabilities, global optimization, and parallelism.Compared with the genetic algorithm and the immune algorithm, there is no need for selection, crossover, and mutation processing.Since the operation is simple, PSO can perform the calculations rather quickly.Due to the information interaction between the particles in the solution process, the convergence speed of the particle swarm can be accelerated.The updated formulas of the particle position and the velocity are:

where and
and are respectively the velocity and the position of the dth dimension of the k+1-th generation of particle i, α is the inertia factor, c1 and c2 are the acceleration factors,
 is the individual optimal position of the dth dimension of the kth generation of particle i, and
 is the optimal position of the dth dimension of the kth generation in the entire population.
Since the distribution network fault location problem is a 0-1 integer programming problem, the optimization method in the continuous space is no longer applicable.Therefore, the binary particle swarm optimization (BPSO) algorithm is adopted in this paper.The updated formulas of the particle position and the velocity are modified.
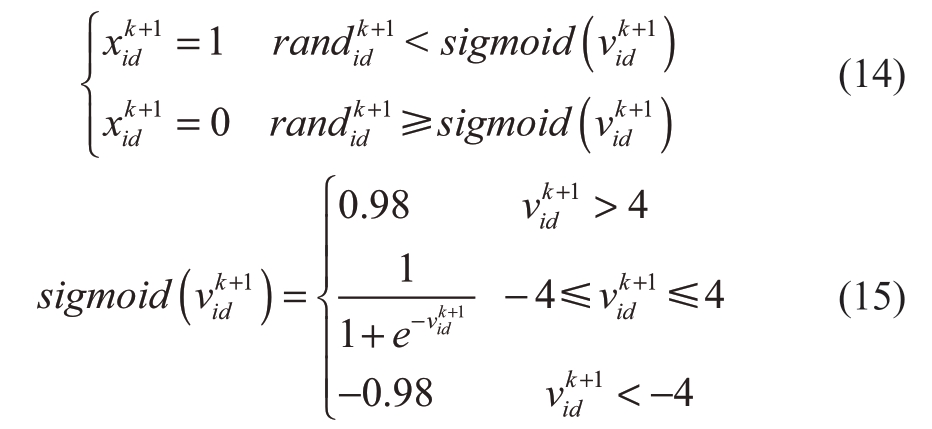
where represents a random number in the [0,1] interval generated in the dth dimension for the k+1-th generation of particle i.
The fitness function is constructed by using information from the FTU method:
where the first term on the right hand side represents the difference between the fault information received by the FTU method and the expected fault information, N1 is the total number of FTUs in the distribution network, Ij(x) is the fault information uploaded by FTU j, (x) is as mentioned above, the second term represents the total number of fault line sections, M is the total number of line sections, x(j) is the line section state, and ω is a random positive coefficient that is not greater than one.
The fitness model constructed from the CEIAS information is as follows:
where the first item on the RHS represents the difference between the actual power supply of abnormal information received by CEIAS and the expected power supply of abnormal information, N2 refers to the total number of customers in the distribution network, Pj(x) provides the abnormal power supply information uploaded by CEIAS, and (x) has been previously stated.
Since the PSO is a population intelligent search algorithm, the particle swarm gradually approaches the optimal solution from the initial position in each iteration.As the number of iterations increases, the proportion of the optimal solution in the particle swarm increases.Therefore, the probability distribution function can be expressed by the concentration of the particles, which satisfies the convergence condition.Since there are solutions with poor fitness in the particle swarm, it is not necessary to consider all of the particles.The particles with the first N concentration are considered and the probability distribution function m can be expressed as:

where ri is a particle in the particle group.
4 Fault location process
· Post-fault information acquisition: The state information of each FTU in the distribution network and the abnormal information of CEIAS are collected.
· Constructing fitness function: For the different information sources, the fitness functions for the difference between the received fault information and the expected fault information are constructed, which are respectively formulas (16) and (17).Due to the different characteristics of the information sources, the expected fault information functions are also different.For the FTU information, please see formula (3).For CEIAS information, please refer to formula (4).
· Optimization solution: BPSO is used to optimize the fault location model proposed in this paper and to obtain the evidence body.
· Parameter initialization of the BPSO algorithm: This includes the acceleration factor α, the inertia factors c1 and c2, the individual optimal solution Pbest, the group optimal solution Gbest, the initial speed v, the maximum speed Vmax, the minimum speed Vmin, the maximum iteration number, and the population size.
· BPSO iterative process: The position and velocity of the particles are updated according to formulas (12), (14 ), and (15).By applying these formulas, particle i of the k+1-th generation  is obtained.The updated particles
 are brought into the fitness function to obtain the fitness value F(
 ).If F(
 )>Pi,best, it is updated as the individual optimal value; if F(
 )>Gbest, it is updated as the global optimal value.
· When the global optimal solution does not change with the number of iterations or the number of computations reaches the maximum number of iterations, the iteration process is stopped, and the optimization results are the output.
· Acquisition of the probability distribution function of the evidence body: The first N concentrations of the particles in the particle group are stored and the probability distribution function is obtained by using formula (14).
· Evidence fusion: To add a complete set Θ to the evidence body and to multiply the original probability distribution density by the discount rate u, please refer to formulas (9), (10), and (11).In addition, apply formulas (7) and (8) for evidence fusion.
· Using decision criterion to determine the fault section: To determine whether or not to converge to more than one solution, the fault section is selected by the following decision criteria.
The flow chart for the fault location process based on the multi-source information is illustrated in Fig.2.
5 Case study
In order to verify the effectiveness and the advantages of the fault location method proposed in this paper, the distribution network model with DGs presented in Fig.3 is adopted for the analysis.In the figure, S is the system power and DG1 and DG2 are the distributed generations in the distribution network.K1 and K2 are the switches that connect the DGs to the distribution network.CB1- CB3 are the incoming circuit breakers, S1-S9 are the sectional switches, L1-L10 are the line section numbers, and A-F are the customer areas in the distribution network.In the distribution network model, the sectional switches and the circuit breakers are equipped with FTUs; thus, the power supply information can be obtained from A-F.
The BPSO and evidence fusion algorithms were compiled with MATLAB.In BPSO, the number of the particle swarm is 100, the maximum number of iterations was set to 100, and the acceleration factors, c1 and c2, were set to 2.1.In the evidence fusion algorithm, N takes on the value of 5.
5.1 Fault location simulation
In order to verify the effectiveness of the algorithm, the following four situations were analyzed.
Situation 1: The section L3 is faulty and the information uploaded by the FTU is incorrect.
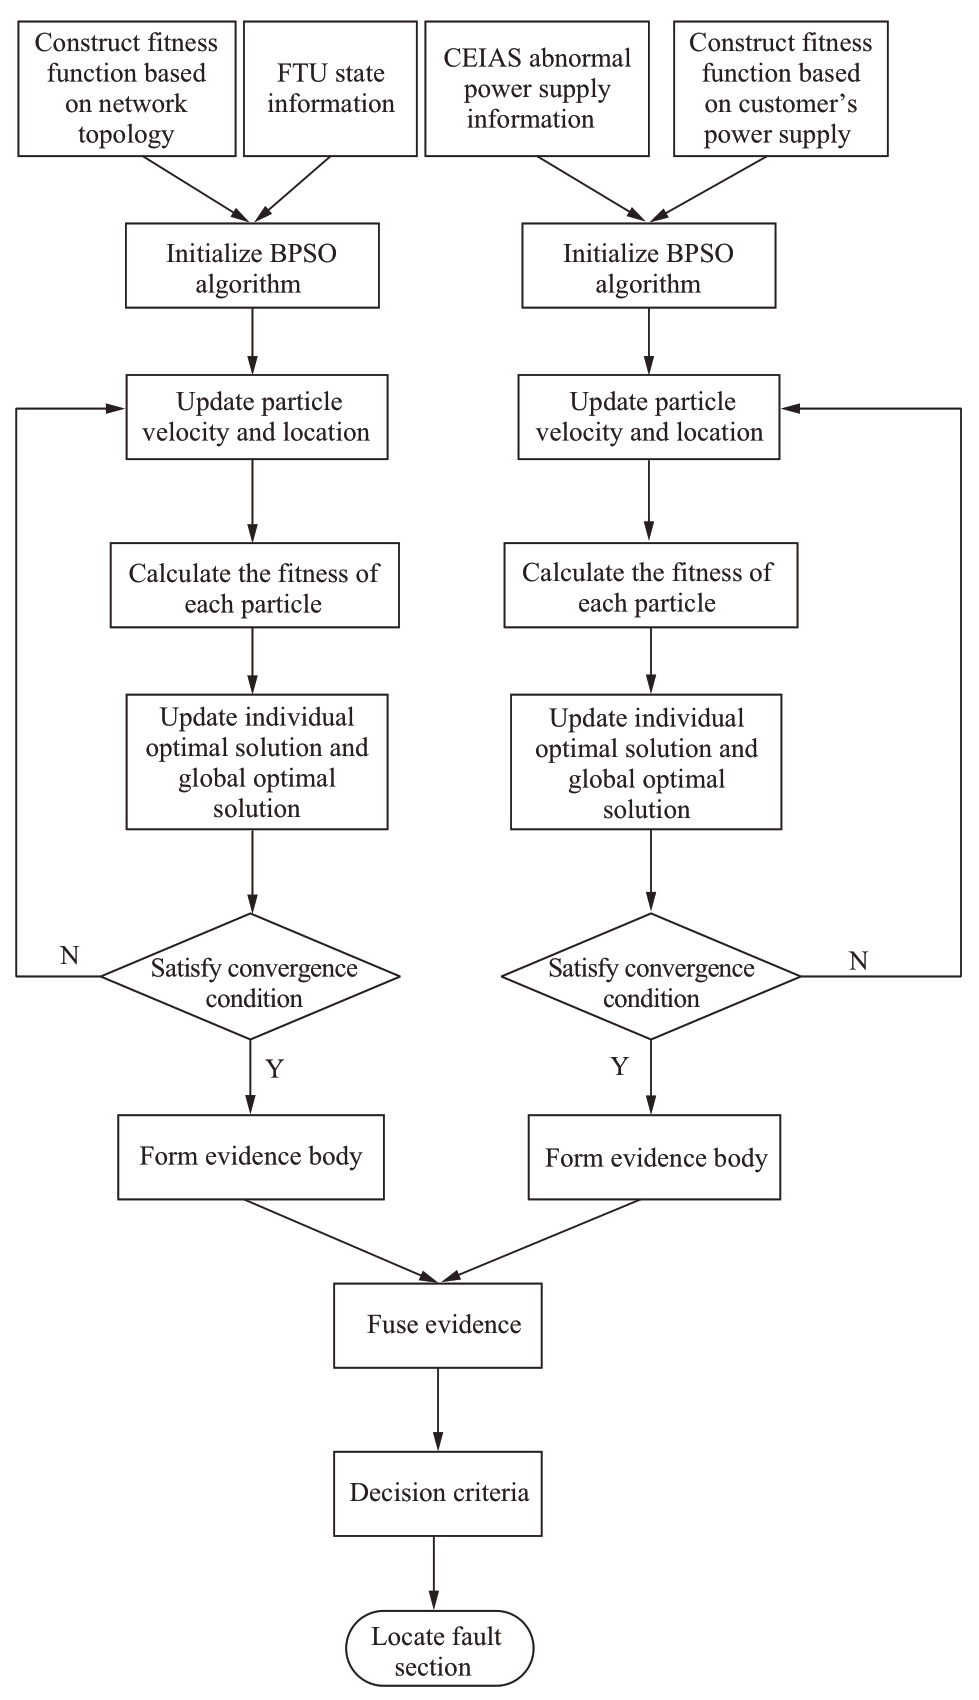
Fig.2 Flow chart of the fault location

Fig.3 Typical distribution network with DG
Situation 2: The section L2 and L4 are faulty and the information uploaded by the FTU is incorrect.
Situation 3: The section L5 is faulty and the information uploaded by the FTU is correct.
Situation 4: The section L5 is faulty and the information uploaded by the FTU is incorrect.
Situation 1:
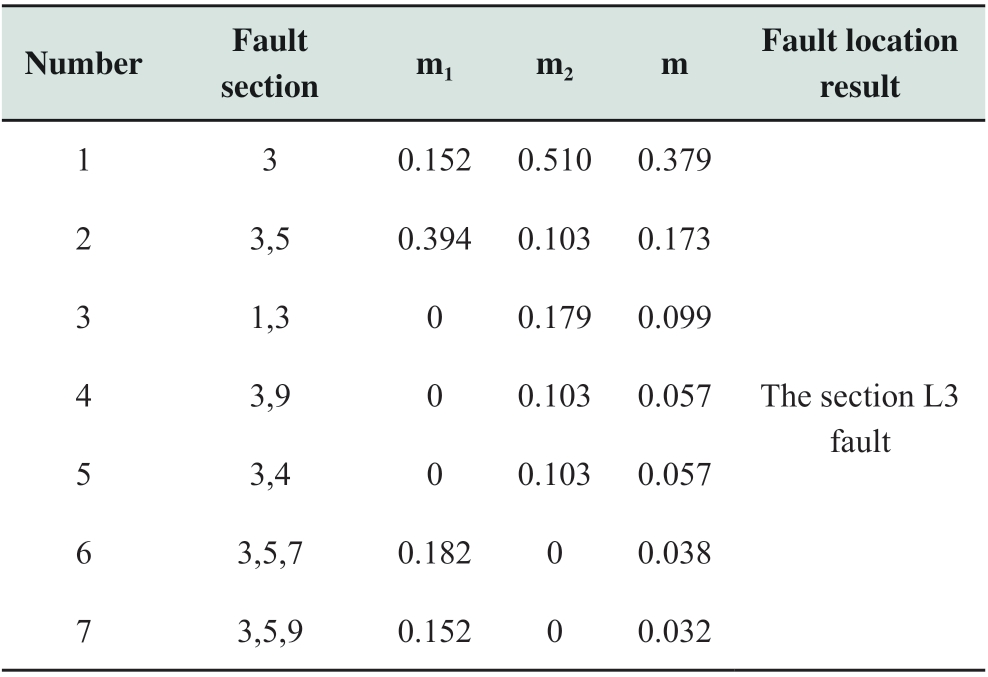
The FTUs upload the information [1,0,1,0,0,0,0,-1,-1,-1,0,-1] while CEIAS uploads the information [0,1,1,1,0].Since both of these converge to the only optimal solution, the maximum probability density solution can be taken directly.In addition, the fault of the section L3 can be concluded.The conclusion matches the actual situation and the specific results are listed in Table 1.However, using the traditional method of the single information source for the fault location, the wrong conclusion for the sections L3 and L5 are faulty and they are obtained.From this situation, it is verified that the algorithm has a higher fault tolerance when a single fault occurs.
Table 1 Simulation results of the single fault with error information
Situation 2:
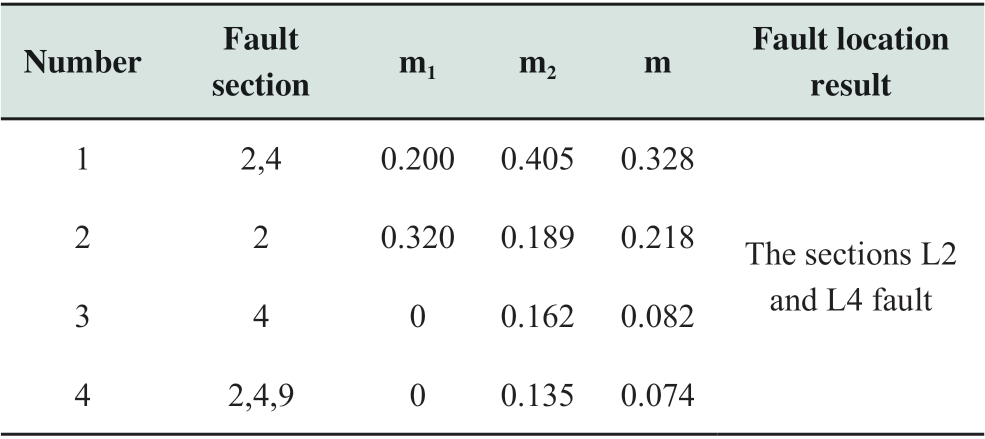
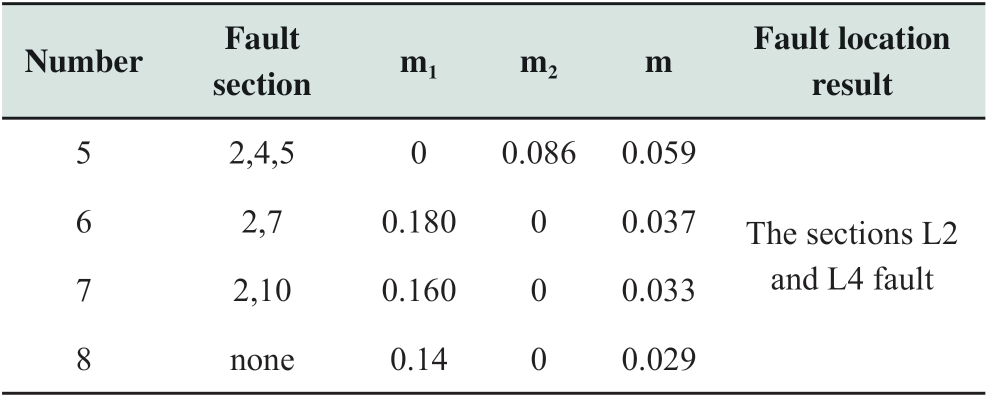
FTUs upload the information [1,1,0,0,-1,0,0,-1,-1,-1,0,-1] and the CEIAS uploads the information [1,1,0,0,0].Since both of them converge to the only optimal solution, the maximum probability density solution can be taken directly.In addition, the fault of sections L2 and L4 can be concluded.From this, the conclusion matches the actual situation; the specific results are presented in Table 2.However, using the traditional method of a single information source for the fault location results in the wrong conclusion for the section L2.From this situation, it is verified that the algorithm has a higher fault tolerance when multiple faults occur.
Table 2 Simulation results of multiple faults with error information
continue
Situation 3:
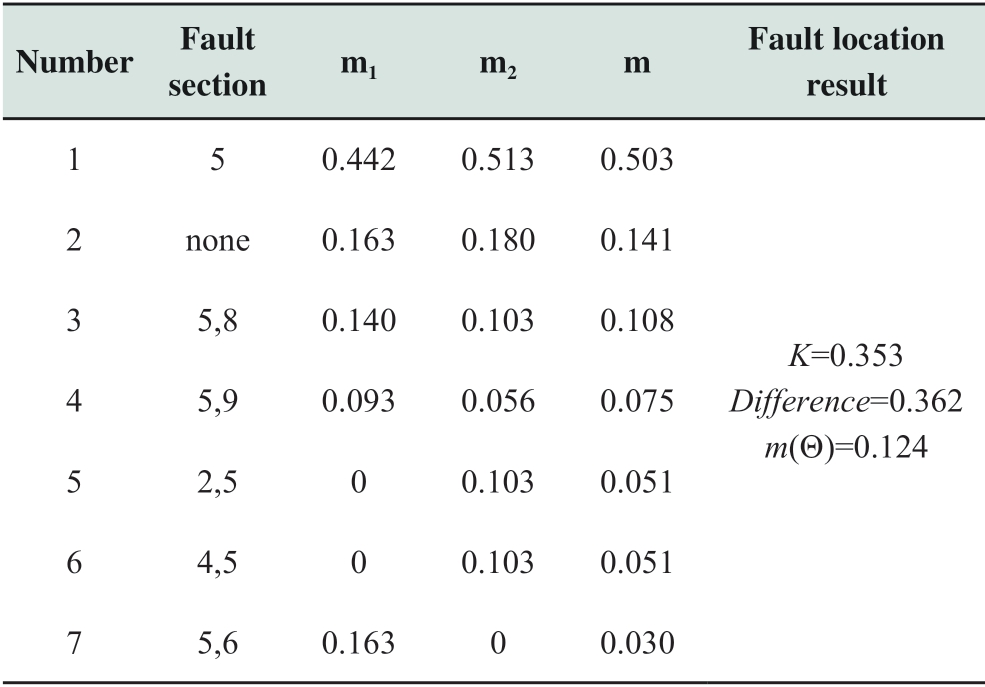
The FTUs upload the information [1,0,1,0,1,0,0,-1,-1,-1,0,-1] whereas CEIAS uploads [0,0,1,1,0].When using the CEIAS information, it converges to three different solutions.Therefore, it is necessary to discuss the three cases separately.The evidence fusion results are described in Tables 3-5.In case 3, the probability density difference is the largest, the value of k is the smallest, and the probability density of the complete set is less than the first focal element.Thus, we accept the maximum probability density focal element of case 3 as the final result and the conclusion of the section L5 fault is obtained.The result is consistent with the actual situation.Through this situation, it is verified that the decision criteria proposed in this paper can effectively solve the problem of converging to multiple solutions when using a redundant information source.
Table 3 Convergence to multiple solutions—case 1
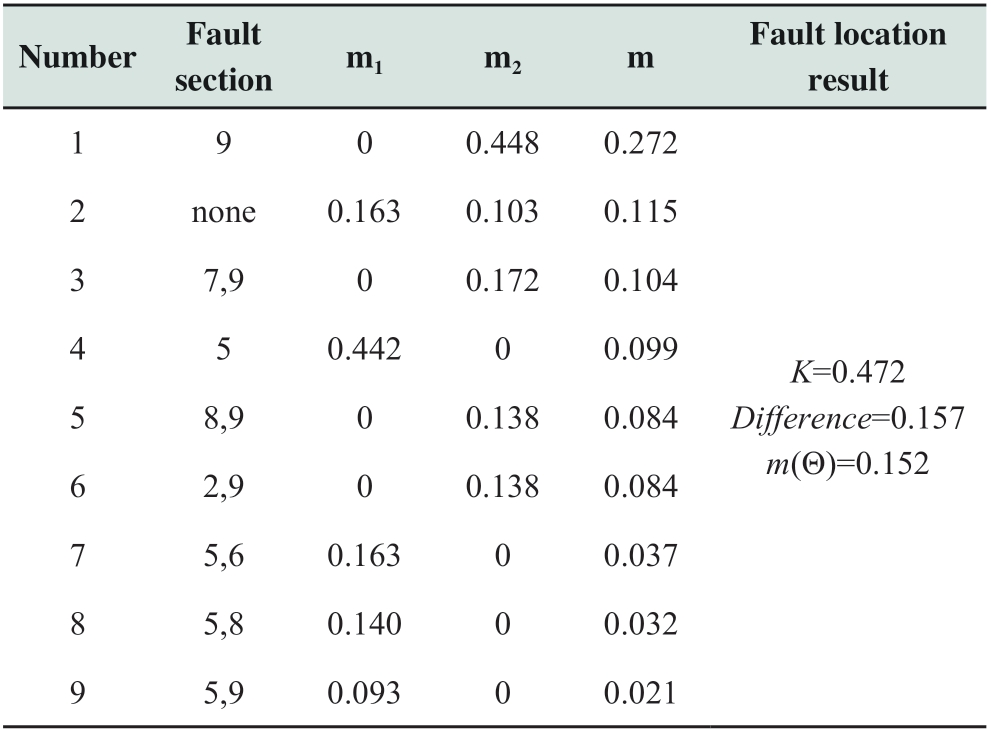
Table 4 Convergence to multiple solutions—case 2

continue

Table 5 Convergence to multiple solutions—case 3
Situation 4:
In the worst case situation, the received information from the FTU method is incorrect and the fault location result of using the CEIAS information converges to multiple solutions.This situation is discussed to verify the effectiveness of the fault location method.The uploaded information of the FTUs is [1,0,1,0,0,0,0,-1,-1,-1,0,-1] and the uploaded information of CEIAS is [0,0,1,1,0].When using the CEIAS information, it converges to three different solutions.Therefore, it is necessary to separately discuss the three cases and the evidence fusion results are depicted in Tables 6-8.In case 1, the probability density difference is the largest, the value of k is the smallest, and the probability density of the complete set is less than the first focal element.Thus, this study accepted the maximum probability density focal element of case 1 as the final result, and the conclusion of the section L5 fault is obtained.The result is consistent with the actual situation.However, using the traditional method of single information source for the fault location, the wrong conclusion that sections L3 and L5 are faulty is obtained.
Table 6 Convergence to multiple solutions with error information—case 1

Table 7 Convergence to multiple solutions with error information—case 2

Table 8 Convergence to multiple solutions with error information—case 2

5.2 Fault location simulation
The specific value of the fault tolerance rate is changed according to the different fault conditions.For this reason, the section L3 fault is set in this paper and there are 24 different types of FTUs reporting information according to the distribution network topology in this paper.The fault tolerance rate of the traditional method is 58.3%.The fault tolerance rate of the method proposed in this paper can reach 83.3%, which can be increased by 25%.However, as the coverage area of CEIAS extends, the fault tolerance rate will increase more.
6 Conclusions
In order to improve the fault tolerance of the fault location algorithm, a fault location method for the distribution network based on multi-source information fusion is proposed in this paper.The following conclusions were obtained from this study:
(1) In view of the serious problem of false alarms and missed alarms of FTU information, CEIAS information with high reliability is introduced as a redundant information source.
(2) Aiming at the situation that the coverage of CEIAS is less than the coverage of FTU, thus it is likely to converge to multiple solutions when using CEIAS information for fault location.As a result, an evidence decision criterion is proposed to determine the fault section.
(3) The validity and feasibility of the proposed method are verified by an example.Even in the worst case, the FTU information is wrong and the CEIAS model converges to multiple solutions.The fault section also can be accurately located.
In this paper, the fault section location method is discussed, which is the first step of the fault location for distribution network.In the future work, we will focus on the accurate fault location method, which can find out the fault point on the section.In the background of promoting the construction of IoT, the information of power customers can be acquired by CEIAS.Meanwhile, more and more DGs are connected to the distribution networks.These reasons provide the possibility for the application of the method in this paper.Since this paper takes CEIAS as redundant information source, the improvement degree of fault tolerance rate is related to the coverage rate of CEIAS.As the coverage area of CEIAS extends, the fault tolerance rate will increase more.
Acknowledgments
This work was supported by the Science and Technology Project of State Grid Shandong Electric Power Company “Research on the style="font-size: 1em; text-align: justify; text-indent: 0em; line-height: 1.8em; margin: 0.5em 0em;">References
[1] BORGHETTI A, BOSETTI M, SILVESTRO M D, et al (2008) Continuous-wavelet transform for fault loaction in distribution power networks: Definition of mother wavelets inferred from fault originated transients.IEEE Transactions on Power Systems, 23(2): 380-388
[2] Zhu J, Lubkeman D L, Girgis A A (1997) Automated fault location and diagnosis on electric power distribution feeders.IEEE Transactions on Power Delivery, 12(2): 801-809
[3] LOTFIFARD S, KEZUNOVIC M, MOUSAVI M J (2011) Voltage sag data utilization for distribution fault loaction.IEEE Transactions on Power Delivery, 26(2):1239-1246
[4] WEI Zhinong, HE Hua, ZHENG Yuping (2002) A refined genetic algorithm for the fault sections location.Proceedings of the CSEE, 22(4):127-130
[5] GUO Yanyan, XIONG Guojiang (2017) Fault section location in distribution network by means of sine cosine al-gorithm.Power System Protection and Control, 45(13): 97-101
[6] YIN Hao, LI Deqiang, MENG Anbo, et al (2016) Fault location for distribution network based on crisscross optimization algorithm.Power System Protection and Control, 44(21):109-114
[7] LIU Bei, WANG Feng, CHEN Chun, et al (2013) Harmony search algorithm for solving fault location in distribution networks with DG.Transactions of China Electrotechnical Society, 28(8): 280-284
[8] MA Shaofei, HU Jun, LIU Qiang, et al (2018) Fault Location of Distribution Network Based on Particle Swarm Optimization, Smart Power, 46(9):83-87
[9] Jiang Y, Liu C C, Diedesch M, et al (2016) Outage Management of Distribution Systems Incorporating Information From Smart Meters.IEEE Transactions on Power Systems,31(5): 4144-4154
[10] Chen Kui, Zhang Yun, Wang Hongyin, et al (2017) Fault-section location of distribution network containing distributed generation based on immune algorithm.Power System Protection and Control, 45(24):57-62
>[11] Li He, Jin Qinglu, Gao Shanbo (2017) Fault Location of Distribution Network with Distributed Generation based on Bat Algorithm.Electrical Engineering, 18(1): 34-38
[12] Liu Yanchao (2017) Fast Fault Section Locating for Dis-tribution Network with Distributed Generations.Electrical Engineering, 9:61-71
[13] GAO Zhanjun, LI Siyuan, PENG zhengliang, et al (2018) Fault location method of distribution network based on tree structure diagram and improved D-S evidence theory.Electric Power Automation Equipment, 38(6): 65-71
>[14] WANG Yansong, ZONG Xueying, YI Jingbo (2018) Fault tolerant algorithm for fault location in distribution network.Electric Power Automation Equipment, 39(3):91-95
[15] BAO Yuechuan, ZHANG Meng, ZHANG Qiaoxia, et al (2019) Fault Diagnosis Method for Distribution System Considering Multitype Failure Hypothesis Variables.Smart Power, 47(2):63-67
[16] WU Fan, ZHAO Jinquan, ZHU Bin, et al (2018) Faulty section location based on MOPSO for distribution networks with distributed photovoltaic generation.Power System Protection and Control, 46(6): 46-53
[17] YANG Ji-ge (2004) Study of fault location for distribution network, Zhengjiang University, Hangzhou
[18] STATE GRID Corporation of China (2009) Power user information collection system function specification.China Electric Power Press, Beijing
[19] Dempster A P (1967) Upper and Lower Proba bilities Induced By A Multivalued Mapping.38(2):325-339
[20] SHAFER G (1976) Mathematical Theory of evidence.Princeton


Scan for more details
Received: 31 August 2019/ Accepted: 9 October 2019/ Published: 25 February 2020
 Wenbo Li
liwenbo_1984@foxmail.com
Jianjun Su
2233766321@qq.com
Xin Wang
187144341@qq.com
Jiamei Li
lijiami@sjtu.edu.cn
Qian Ai
aiqian@sjtu.edu.cn
2096-5117/© 2020 Global Energy Interconnection Development and Cooperation Organization.Production and hosting by Elsevier B.V.on behalf of KeAi Communications Co., Ltd.This is an open access article under the CC BY-NC-ND license (http: //creativecommons.org/licenses/by-nc-nd/4.0/ ).
Biographies
Wenbo Li received Ph.D.degree at Shandong University, Shandong, 2013, bachelor degree at Shandong University, Shandong, 2008.He is working in State Grid Shandong Electric Power Research Institute, Shandong.His research interests includes electric power system analysis and control, energy internet.
Jianjun Su is working in State Grid Shandong Electric Power Company, Shandong.His research interests includes the production of electric power system, the management of electric power system.
Xin Wang is working in State Grid Shandong Electric Power Research Institute, Shandong.His research interests includes the protection and control of electric power system, large grid security.
Jiamei Li received bachelor’s degree at Sichuan University, Chengdu.She is working towards Ph.D.degree at Shanghai Jiao Tong University, Shanghai.Her research interests includes the operation of the virtual power plant.
Qian Ai received the Bachelor’s degree from Shanghai Jiao Tong University, Shanghai, China; the Master’s degree from Wuhan University, Wuhan, China; and the Ph.D.degree from Tsinghua University, Beijing, China, in 1991, 1994, and 1999, respectively, all in electrical engineering.His current research interests include power quality, load modeling, smart grids, microgrid, and intelligent algorithms.
(Editor Dawei Wang)
