1 Introduction
According to preceding studies, some research papers are published for solar PV, interconnector and hydro power including pumped hydro energy storage (PHES).For solar PV, an assessment for the allocation in Japan is proposed [1], but it is necessary to enhance a power grid.Regarding the interconnector in Asia, some studied has been already executed [2-5].The large scale hydro power is considered with solar PV and Wind as hybrid system [6-9].Some PHES usages are introduced as an absorber for variable renewable energy resources such as solar PV and wind [10-14].But a relationship among solar PV, cross-regional interconnector and PHES in adjacent area with a unique situation in Japan has not been studied yet.
In this study, a new operational method to mitigate the curtailment of solar PV generation is proposed for the further introduction of solar PV in Japan.
First, the reason for the significant increase in the amount of solar PV generation is the Feed in Tariff (FiT) system.The amount of introduction is summarized in each source and year.Next, as a difference from other countries, the priority dispatch rule which is still valid in Japan is explained.Then the circumstances for the solar PV curtailment is shared.Under these conditions, in October 2018, the solar PV curtailment executed in the Kyushu area.The current status about frequency of curtailment is summarized.Regarding the actual data, the power generation amount for each power source with demand per hour are published by the power company, so it is used in this study.
Second, the configuration and operation of crossregional interconnector is summarized.9 areas are connected by cross-regional interconnector each other.The overall situation for the demand in each area and the operation capacity of each cross-regional interconnector are summarized.Focusing on the Kyushu area, which is the target of this study, the details of the demand and the specifications of cross-regional interconnector (Kanmon line), which is the only cross-regional interconnector for the Kyushu area, is explained.Regarding the actual power flow data of cross-regional interconnector, the values for each cross-regional interconnector are published every 5 minutes from the Organization for Cross-regional Coordination of Transmission Operators, JAPAN (OCCTO).
Third, the introduction of PHES is summarized with the relationship of nuclear power plants that are constructed at the same time historically in Japan.
Finally, a new operational method is proposed to mitigate the solar PV curtailment by a combination of crossregional interconnector and PHES in adjacent area.The price is used in the spot market of Japan Electric Power Exchange (JEPX) for every half an hour.It shall be taking into consideration for the unbundling of the incumbent electric utilities in 2020.It means that the owner of PHES will procure electricity from the market instead of retailer.
2 Solar PV
2.1 Renewable energy introduction and feed in tariff
Since the introduction of FiT to Japan in 2012, the amount of installed capacity has increased, especially for solar PV.The time series for all renewable energies under FiT is shown in Fig.1 from the Ministry of Economy, Trade and Industry (METI) [15].As a result, the amount of solar PV was only 7.3 GW in FY2012, but it becomes 44.5 GW in FY2017, with an average annual growth rate of 22% for all renewable energy and 44% for solar PV.
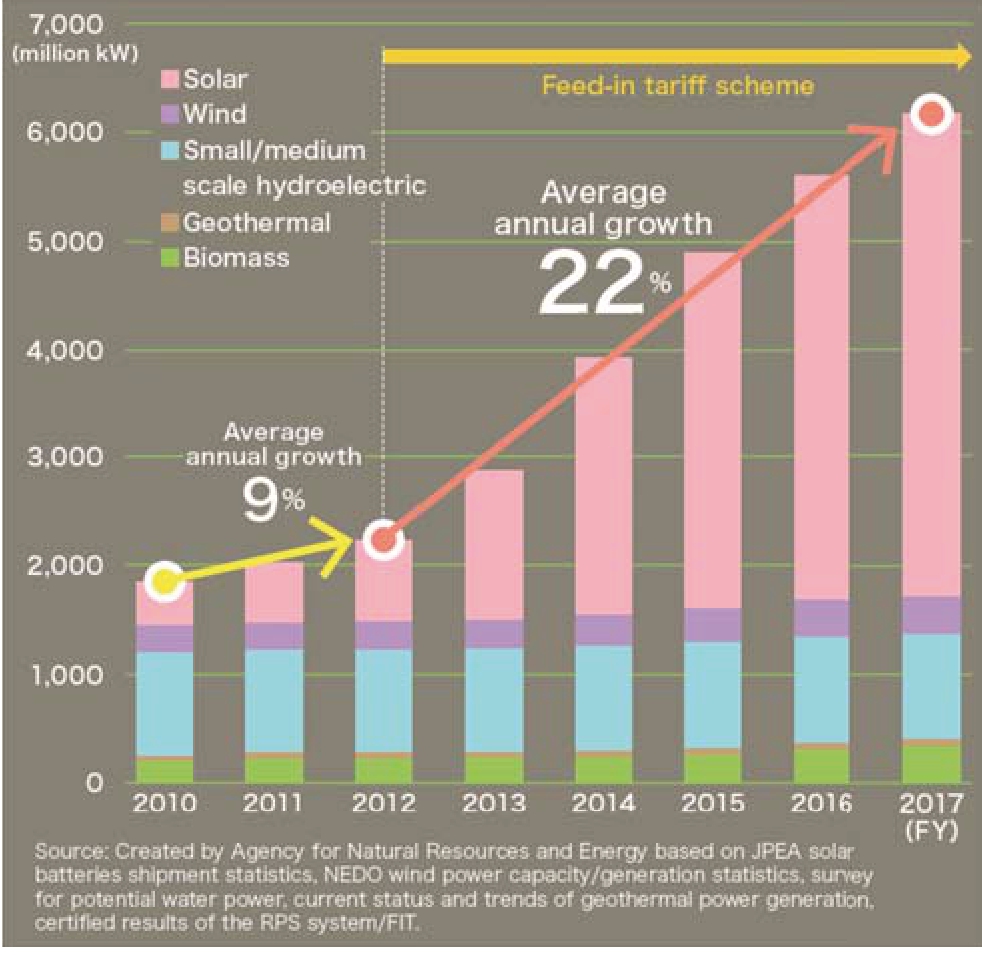
Fig.1 Introduction of renewable energy
2.2 Priority dispatch rule
The priority dispatch rule is established by OCCTO and followed by each electric power company.It defines the conditions and order of curtailment for operating power generation sources according to fluctuations in demand etc., in order to match the balance between supply and demand.Table 1 shows a summary of the order of priority dispatch rule [16].
Table 1 Priority dispach rule
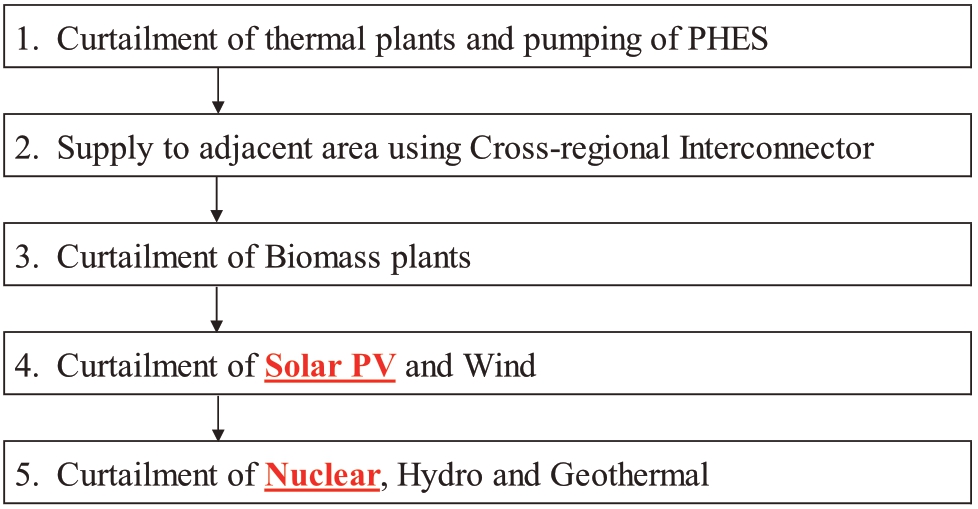
As a result, before the output of solar PV is curtailed, the output of thermal power plant is reduced, and / or the pumping of PHES in the area is conducted.On the other hand, the nuclear power plant is regarded as one of a base load sources.
2.3 Curtailment days in the Kyushu area
Fig.2 below shows a demand and supply balance on daily average in the Kyushu area from April 2016 to May 2019 [17].It seems that the curtailment has been executed since the all of four nuclear reactors fully re-operated from around September 2018 on top of the solar PV installed.
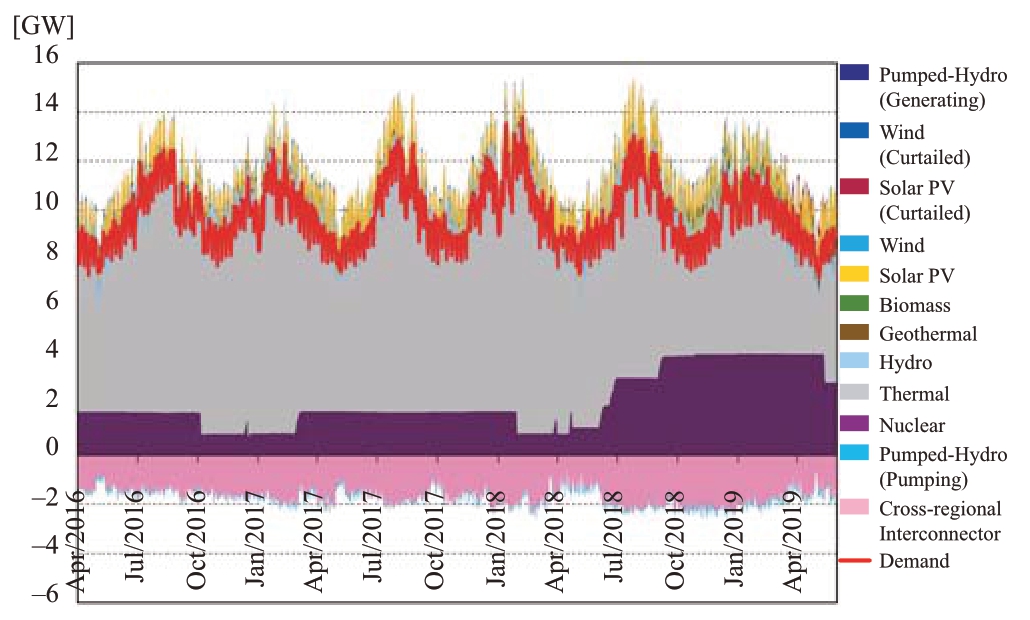
Fig.2 Demand and Supply balance on daily average in the Kyushu area from April 2016 to May 2019
Fig.3 below summarizes the number of days per week of solar PV curtailed in the Kyushu area for one year from June 2018 to May 2019 [18].
From this, it can be seen that since the first curtailment was carried out in October 2018 due to the high irradiation of clear sky on weekend.After that, it has been carried out very often, especially from March 2019 to the beginning of May 2019 during the low demand season with high irradiation on average.In particular, all 7 days were curtailed from May 2nd to 8th, 2019.The analysis in the later section about utilization will focus on this week.
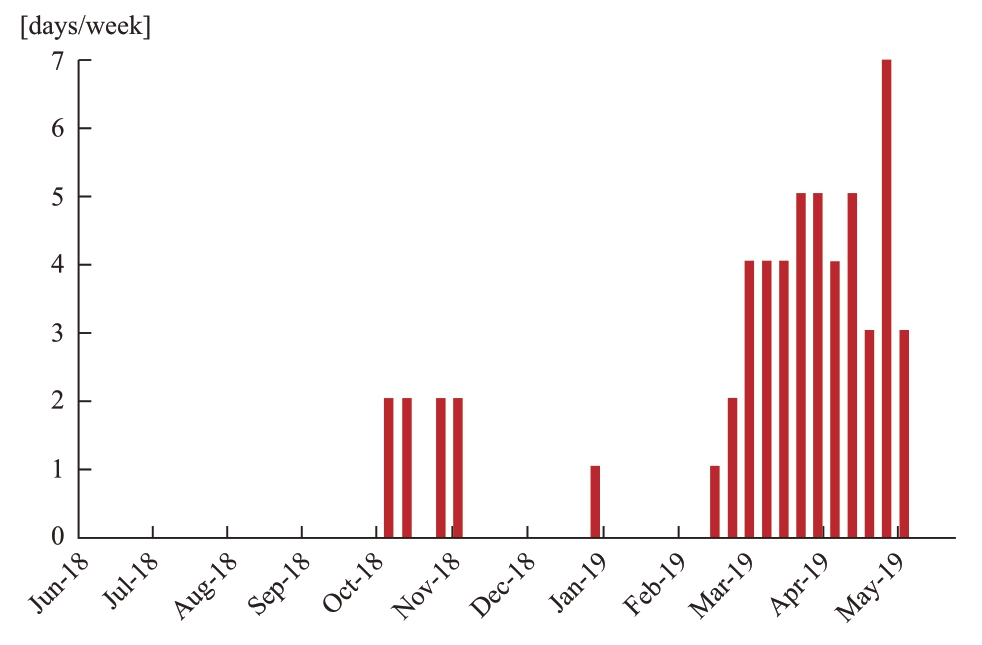
Fig.3 Curtailment days in the Kyushu area
3 Cross-reigional interconnector
3.1 Configuration of cross-regional interconnectors
In Japan, 9 power areas are connected by cross-regional interconnector.Fig.4 shows the demand in each electric power area and the operational capacity of each crossregional interconnector in May 2019 [19].The analysis in the later section about utilization will focus on the crossregional interconnector between the Kyushu area and the Chugoku area (Kanmon line).
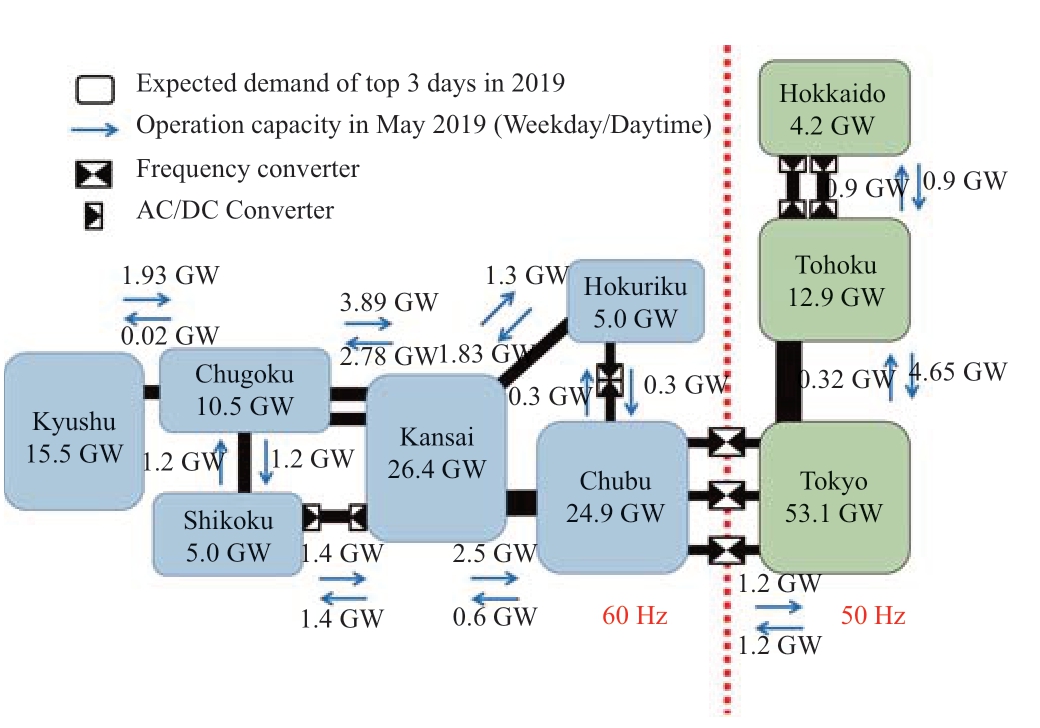
Fig.4 Configuration of cross-regional interconnectors
3.2 Rule of usage for cross-regional interconnector
Regarding the usage for the cross-regional interconnectors, until September 2018, it was a hybrid type of a firstcome-first-serve basis and an implicit auction where the remaining available capacity was traded on the market.However, since October 2018, it has been traded on the market through implicit auction only.This eliminates the first-come-first-served basis and facilitates a smooth transition to a complete implicit auction.As a transitional measure, operators with first-come-first-served capacity can retain their rights for a maximum of 10 years.
4 Pumped hydro energy storage (PHES)
4.1 Introduction of PHES in the world
The amount of installed capacity of PHES worldwide is shown in Fig.5 [20].
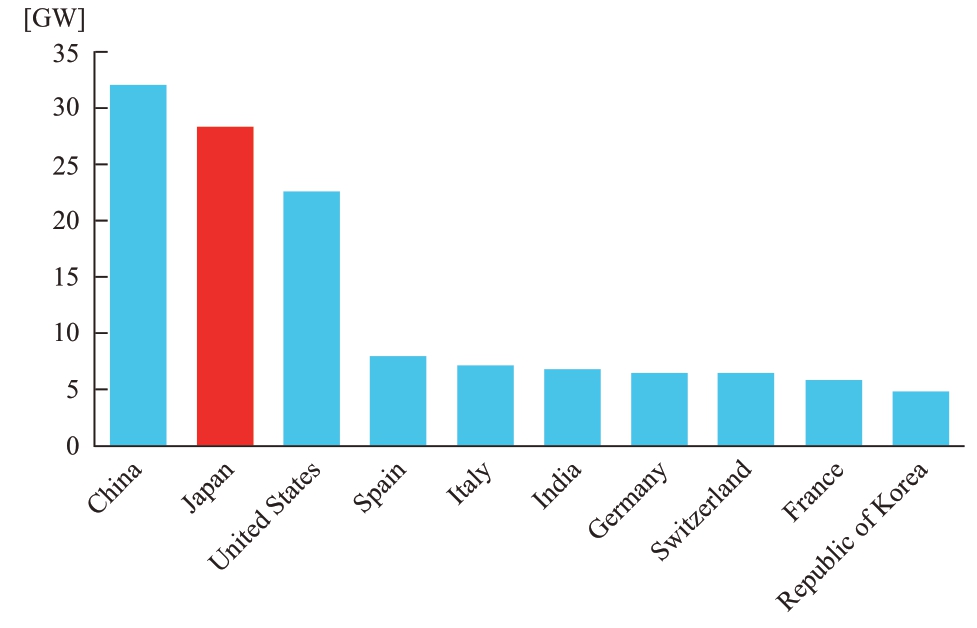
Fig.5 Introduction of PHES in the world
Japan has the world’s second largest installed capacity of PHES.There are three major countries more than 10 GW.Those are China, Japan, and the United States, which are 32.0 GW, 28.3 GW, and 22.6 GW, respectively.
4.2 Introduction of PHES in Japan
The time series for installed capacity for PHES is shown in Fig.6 [21].There are two types of PHES, such as fixed and variable speed type for pumping.The introduction of PHES began in the 1960s.In the early days, only the fixed speed type PHES was installed.After the middle of 1990s, it was replaced by the variable speed type accordingly.
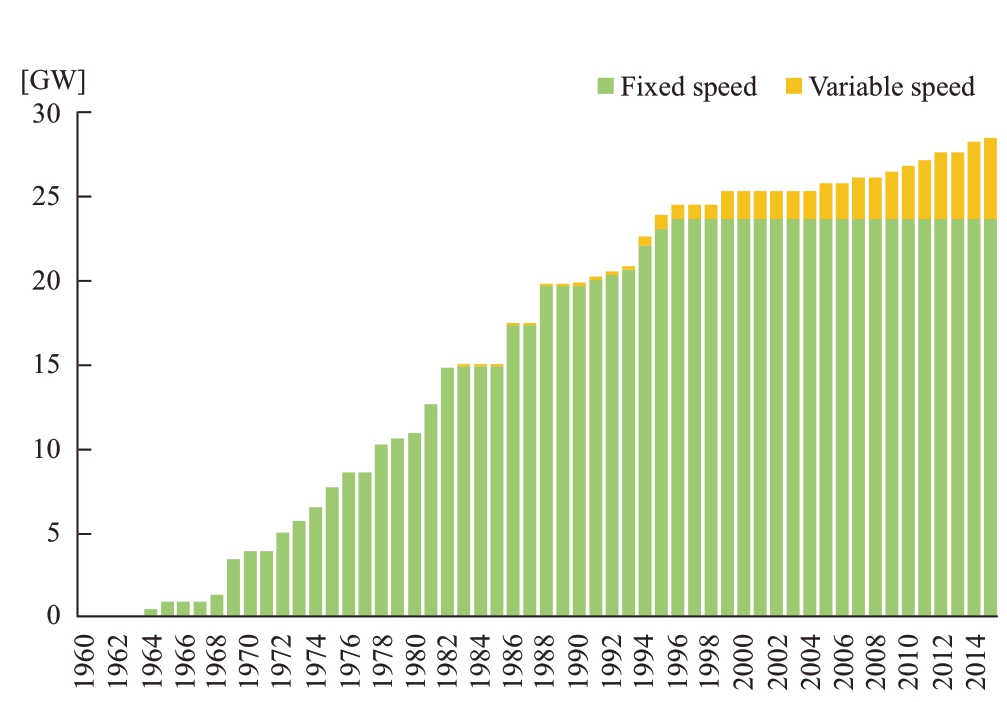
Fig.6 Introduction of PHES in Japan
In 2015, the cumulative installed capacity is 23.7 GW for the fixed speed type, accounting for 83% of the total 28.5 GW.Since around the 2000s, newly installed capacities are only the variable speed type, and the cumulative installed capacity in 2015 is 4.8 GW.It becomes possible to operate more flexible using the variable speed type for pumping.
4.3 Combination of PHES and nuclear power station
From the history of electric power generation facilities in Japan, the PHES has been built along with nuclear power plants.This is because the PHES was used to absorb the nuclear power generation with a constant output at night when the demand decreased.Therefore, the location of the PHES tends to close to the nuclear power plant.The amount of PHES and nuclear power plant in each area is shown in Fig.7 [22].This shows that the amount of PHES and nuclear power plant in each area is roughly proportional.
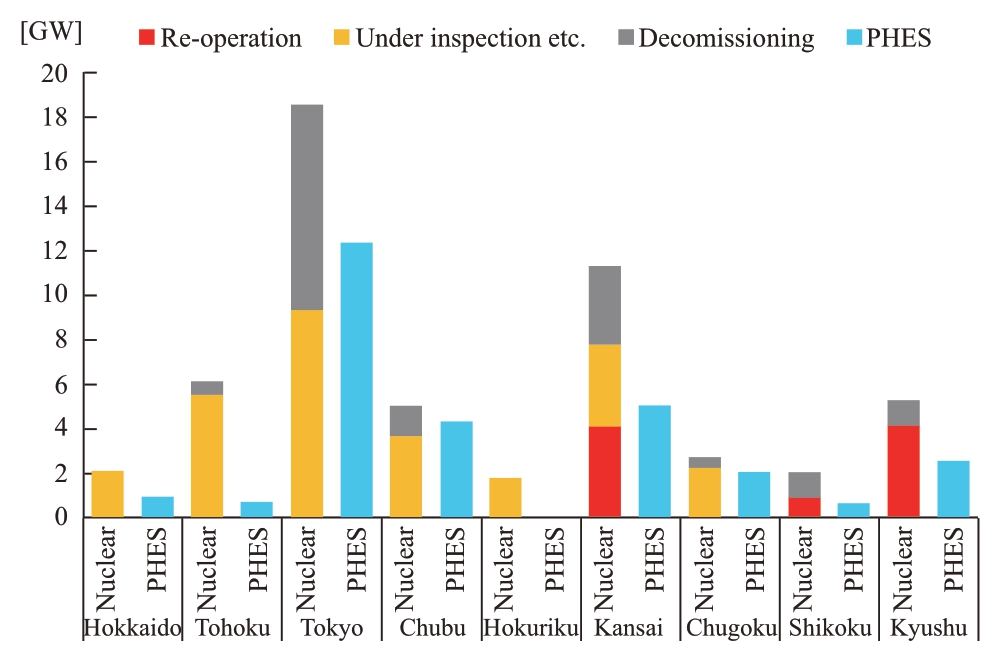
Fig.7 I nstalled capacity of PHES and nuclear power station in each area
The nuclear power plants are divided into three categories, such as “Re-operation”, “Under inspection etc.” and “Decommissioning”.If the decommissioning is subtracted, the installed capacity of PHES becomes relatively large, that is, surplus.It might be difficult to reactivate nuclear power plants under inspection.Therefore, it is hoped that active utilization of the PHES should be studied not only in the Tokyo area and the Kansai area, where there are many decommissioning plants, but also in the Kyushu area.
4.4 Conventional operation of PHES
A conceptual diagram regarding the power generation method of each power source with demand is shown in Fig.8 [23].Especially for PHES that is shaded in black, the output of nuclear power generation is constant in the low demand period at night, so there is still surplus even if the output of thermal power generation is reduced, and it is absorbed by pumping of PHES.
In addition, during the day, the output of thermal power generation is increased to cope with the high demand period, but the shortage is still compensated by the generation of the PHES as part of the hydro power.This is a typical operation method of PHES.
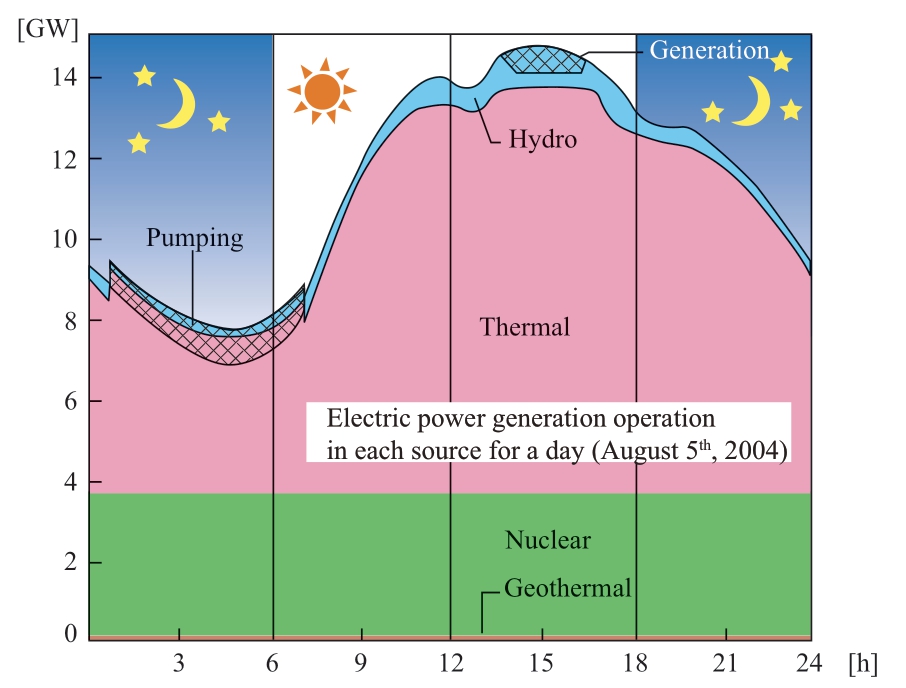
Fig.8 Conventional operation of PHES (Source:Kyushu Electric Power Company, and translated by author)
5 Utilization
5.1 Outline
This analysis is based on actual data for the Kyushu area where curtailment is currently executing frequently in Japan.
The period is focused on one week from May 2nd to 8th, 2019, when the solar PV was curtailed for one whole week.The demand and supply data for the Kyushu area is released from the Kyushu Electric Power Company [18], and the data for cross-regional interconnector between the Kyushu area and the Chugoku area (Kanmon line) is released from OCCTO [24].The capacity of PHES is released from the Chugoku Electric Power Company [25].The spot market price is released from JEPX [26].
The process includes 4 steps, first of all, the amount of curtailment is calculated from the demand and supply data in the Kyushu area.Then, the available capacity for the Kanmon line, which is the cross-regional interconnector between the Kyushu area and the Chugoku area.After that, the capacity and operation status for PHES are grasped from the data of the Chugoku area.Finally, the cost and profit shall be calculated using the spot market price data by JEPX.Additionally, the points to be noted this utilization are also described.
5.2 Curtailment in the Kyushu area
The demand and supply balance for the Kyushu area from May 2nd to 8th 2019 is shown in Fig.9.The solar PV curtailment was implemented for a whole week.During the daytime when the output of solar PV generation is large, the output of thermal power generation is suppressed in accordance with the current priority dispatch rules, pumping of PHES within this region is started, and the electric power is supplied to adjacent areas through cross-regional interconnector.
If these measures are not enough, the curtailment of solar PV is implemented in the certain time slot.From the above, it can be said that there is no concern with the current operations how to balance demand and supply in the Kyushu area.
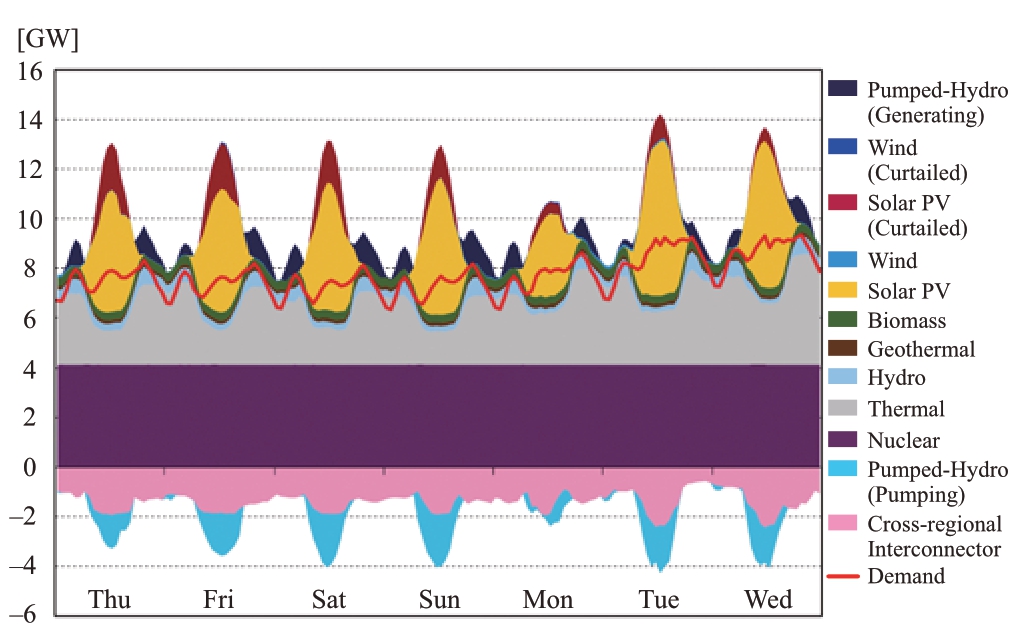
Fig.9 Demand and Supply balance in the Kyushu area from May 2nd to 8th, 2019
5.3 Capacity for cross-regional interconnector
The Kyushu area is located in west area in Japan, and is connected to only adjacent the Chugoku area.As a result, the operating capacity of the cross-regional interconnector (Kanmon line) remains at a capacity that can be less that the threshold of frequency increase in the Kyushu area in the event of a cross-regional interconnector accident.The actual rate capacity is 2.8 GW, but the operating capacity remains at around 2 GW.
In detail, if the cross-regional interconnector is shut down due to the sudden accident, the shortage of the electric power in the Chugoku area will be covered by the opposite adjacent areas such as the Shikoku area and / or the Kansai area.On the other hand, in the Kyushu area, the surplus electric power will cause the frequency increase and become black out if it is more than the threshold frequency.But, in this study, the electricity generated form solar PV is assumed to be sent from the Kyushu area to the Chugoku area and the solar PV has a frequency control function to avoid increasing the frequency in the Kyushu area.
The flow and capacity situation for the cross-regional interconnector (Kanmon line) from May 2nd to 8th, 2019 is shown in Fig.10.
This is the same period for the curtailment of solar PV is implemented in the Kyushu area same as in the previous section.From this, it can be seen that when the curtailment is implemented, the operating capacity is used up to the upper limit (operational capacity) and there is not any available capacity.However, it can be seen that a room of about 1 GW when considering the capacity is up to 2.8 GW, which is the rated capacity of the transmission line itself.
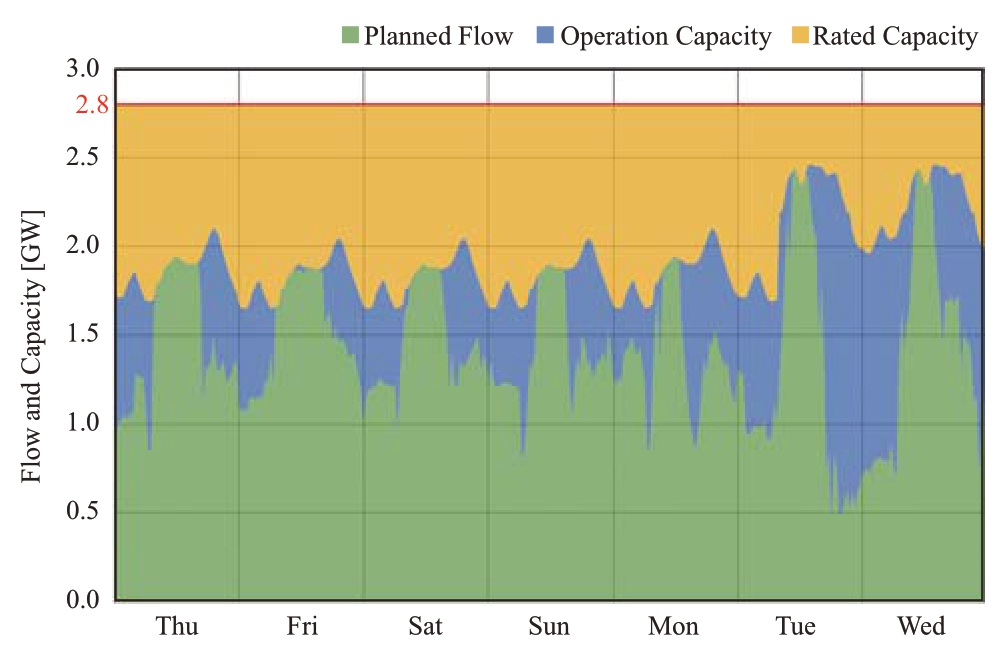
Fig.10 Capacity and flow for the cross-regional interconnecter from the Kyushu area to the Chugoku area from May 2nd to 8th, 2019
5.4 Operation for PHES in the Chugoku area
Regarding the PHES in the Chugoku area, it is summarized in Table 2.
There are three plants, such as Matanogawa, Nobara and Shin-Nariwagawa.The total pumping capacity is 1,200 MW, 600 MW and 210 MW, and the total generating capacity is 1,200 MW, 620 MW and 300 MW respectively.All three of them have been in operation since the 1960s to 1980s.
Table 2 PHES in the Chugoku area

Fig.11 and Fig.12 show the operational status of PHES in the Chugoku area for the same one week above from May 2nd to 8th, 2019.
The thin colored lines are the actual operation result in each day.The pumping and generating value becomes zero every day, it means that the reservoir becomes empty every day to be able to use full capacity.
The red line in each figure is set using the installed capacity and operating time of PHES.The power generation is assumed to be 70% of the pumping time for this study.The time zone is set manually to maximize utilization.From these figures, it is observed that there are some rooms to use for the amount of curtailment is the Kyushu area.The calculation including price mentioned in the following section.
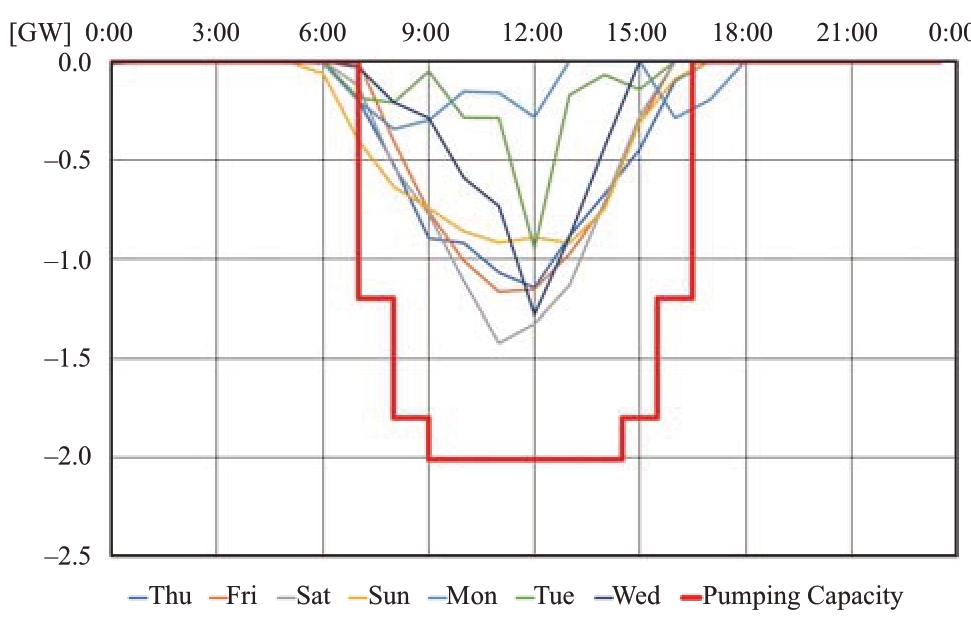
Fig.11 PHES operation and available capacity for PUMPING in the Chugoku area from May 2nd to 8th, 2019
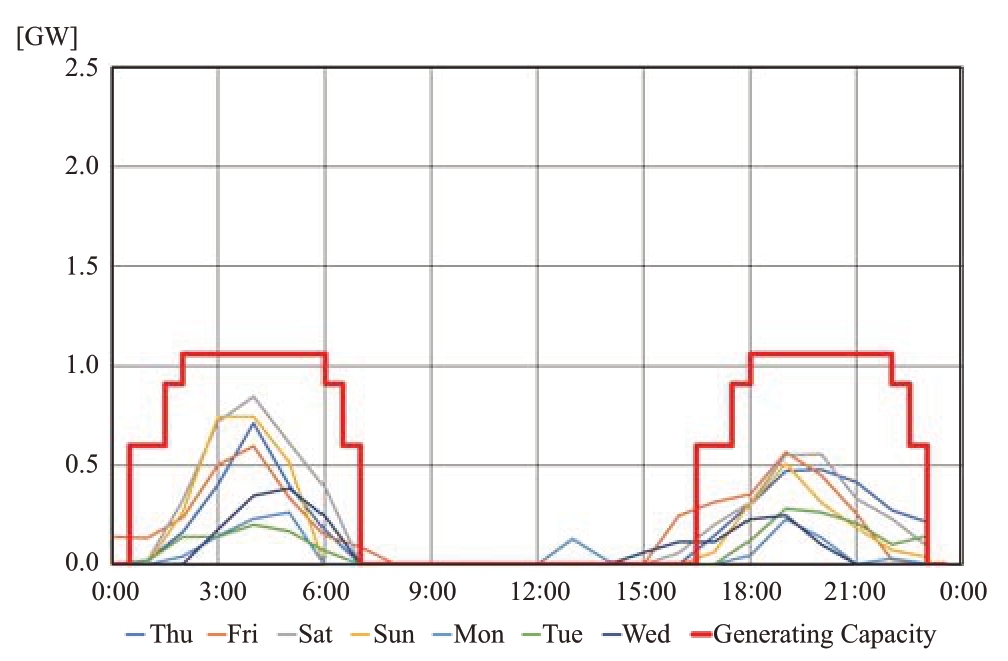
Fig.12 PHES operation and available capacity for GENERATING in the Chugoku area from May 2nd to 8th, 2019
5.5 Transaction of PHES in Market
The amount of curtailment in the Kyushu area through the available capacity for Kanmon line, and the rooms of PHES in the Chugoku area are analyzed until previous section.In this section, the amount of pumping and generating for PHES are calculated using the spot market data (area price) by JEPX.
The time series data for the area price in the Chugoku area from May 2nd to 8th, 2019 is shown in Fig.13.And the duration curve of Fig.13 is shown in Fig.14.It can be seen the 0.01 JPY/kWh in that period.The cost of PHES pumping, that is a kind of storage, is 37.4 million JPY (about 0.30 million EUR).
After storing the electric power to PHES during the day, the electric power is generated at night on that day.The income of PHES generating is 189.6 million JPY (about 1.52 million EUR).Therefore, the weekly profit from this series will be 152.2 million JPY (about 1.22 million EUR).
In this study, the market is assumed as existing spot market.But in the future, the new market shall be taking into account just discussing under the Japanese government such as balancing market and so on.
This is only a provisional calculation for a period in which curtailment lasted for a whole week, but it can be said that it is worth considering as soon as the amount of curtailment will increase in the future.
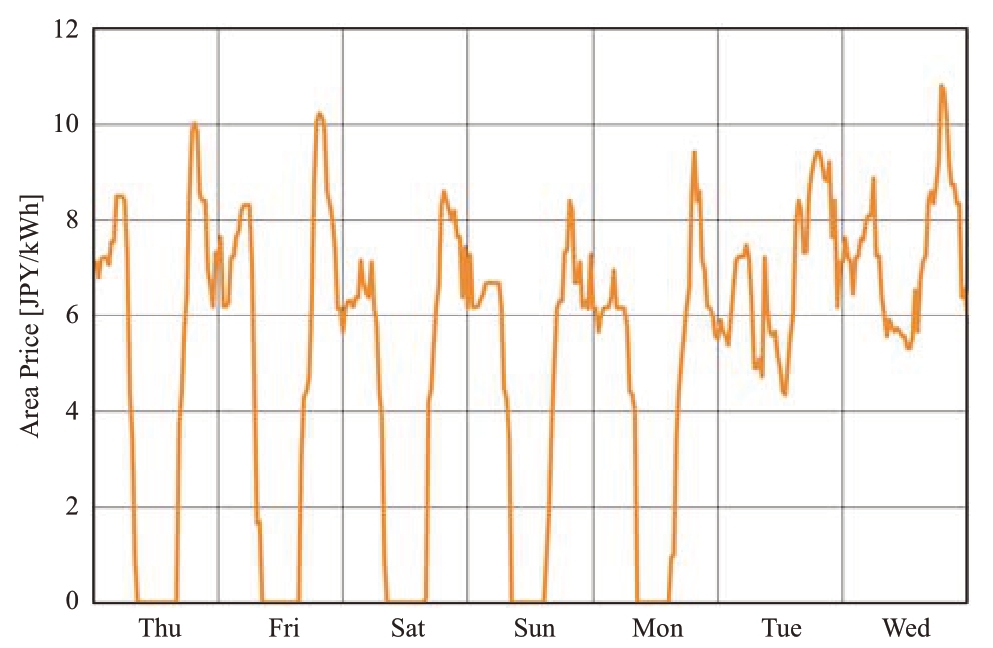
Fig.13 Area price in the Chugoku area from May 2nd to 8th, 2019
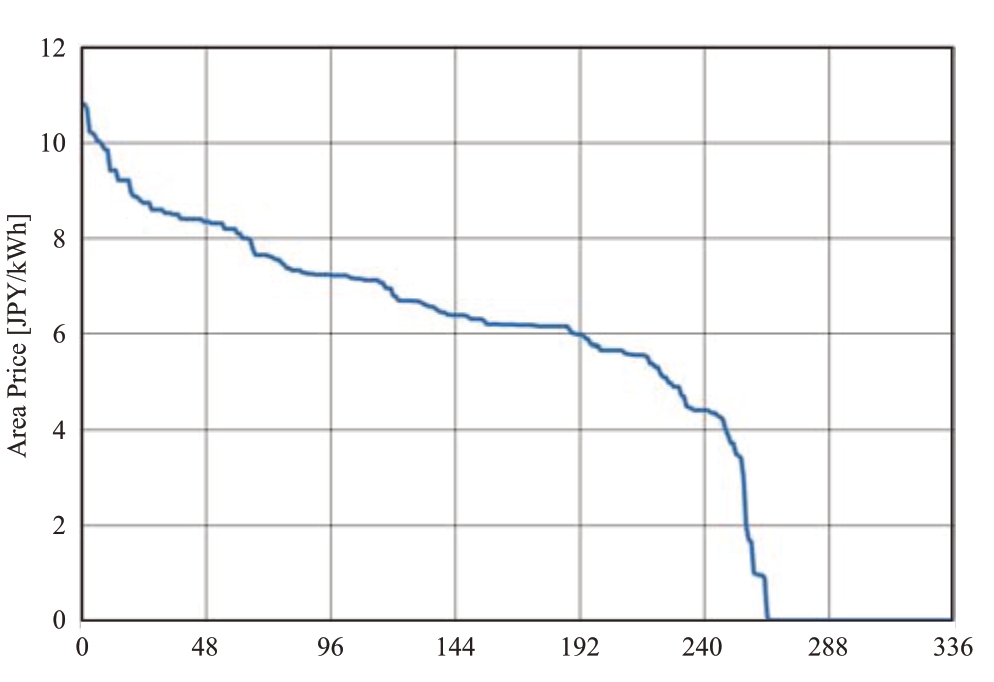
Fig.14 Duration curve of area price in the Chugoku area from May 2nd to 8th, 2019
5.6 Points to consider
Regarding this study, it is important to note that the power generation company purchases the electric power after the incumbent utility is unbundled.And, regarding the calculation of the available capacity of the crossregional interconnector, the point of calculation with the rated capacity is also different from the current situation.However, this point is appropriate because the increase in frequency in the event of an accident can be suppressed by instantaneously stopping the amount curtailment of solar PV under consideration this time.
6 Conclusions
In this study, the actual data is used to derive the benefits of the solar PV curtailment in the Kyushu area to the PHES in the Chugoku area through the cross-regional interconnector.
Before starting the detail analysis, it is summarized for the solar PV, cross-regional interconnector and PHES with the current situation in Japan.
Just changing the operation, not only it becomes possible to suppress the amount of curtailment for solar PV but also this revealed a profit of 152.2 million JPY (about 1.22 million EUR) per week using the spot market data by JEPX.
Although it is necessary to pay attention to the unbundling of incumbent utility and the available capacity for the cross-regional interconnector, it can be said that this is an effective measure for mitigating the curtailment of solar PV in the future.
References
[1] Komiyama R, Fujii Y (2019) Optimal integration assessment of solar PV in Japan’s electric power grid.Renewable Energy, Vol.139, pp: 1012-1028
[2] Ichimura S, Omatsu R (2019) Route designs and cost estimation for Japan-Russia and Japan-South Korea interconnections.Global Energy Interconnection, 2(2): 133-142
[3] Kimura S, Ichimura S (2019) Cost-profit analysis for Japan-Russia and Japan-South Korea interconnectors.Global Energy Interconnection, 2(2): 114-121
[4] Shi X, Yao L, Jiang H (2019) Regional power connectivity in Southeast Asia: the role of regional cooperation.Global Energy Interconnection, 2(5): 445-457
[5] Li J, Gao G, Ma L, et al (2019) Analysis of profit models for cross-border power interconnection projects.Global Energy Interconnection, 2(5): 458-465
[6] Yang Z, Liu C, Wu M (2019) Leading-edge technologies in hydropower development in China.Global Energy Interconnection, 2(3): 244-253
[7] Deng Z, Xiao J, Zhang S, et al (2019) Economic feasibility of large-scale hydro-solar hybrid power including long distance transmission.Global Energy Interconnection.2(4): 290-299
[8] Lu J, Shen J, Su C, et al (2019) Trans-regional transmission of large-scale hydropower: problems and solutions in receiving power grid.Global Energy Interconnection, 2(4): 342-350
[9] Liu G, Qin H, Tian R, et al (2019) Non-dominated sorting culture differential evolution algorithm for multi-objective optimal operation of Wind-Solar-Hydro complementary power generation system.Global Energy Interconnection, 2(4): 368-374
[10] Ichimura S, Kimura S (2019) Present status of pumped hydro storage operations to mitigate renewable energy fluctuations in Japan.Global Energy Interconnection, 2(5): 424-429
[11] Cheng C, Baker A, Stocks M, et al (2019) Pumped hydro energy storage and 100% renewable electricity for East Asia.Global Energy Interconnection, 2(5): 387-393
[12] Wang H, Peng C (2019) Study on integrated development and hybrid operation mode of nuclear power plant and pumped-storage power station.Global Energy Interconnection, 2(4): 336-341
[13] Liu B, Zhou B, Yang D, et al (2019) Optimal capacity planning of combined renewable energy source-pumped storage and seawater desalination systems.Global Energy Interconnection, 2(4): 310-317
[14] Li J, Yi C, Gao S (2019) Prospect of new pumped-storage power station.Global Energy Interconnection, 2(3): 235-243
[15] METI, “JAPAN’S ENERGY 2018”, https://www.enecho.meti.go.jp/en/category/brochures/pdf/japan_energy_2018.pdf [Accessed December 2019]
[16] Kyushu Electric Power Company, “Priority Dispatch Rule”, https://www.kyuden.co.jp/var/rev0/0055/4202/ob3v76j5.pdf, (Japanese) [Accessed December 2019]
[17] OCCTO, “Disclosure for hourly data of Demand and Supply balance in each area since 2016”, https://www.occto.or.jp/oshirase/sonotaoshirase/2016/170106_juyojisseki.html, (Japanese) [Accessed December 2019]
[18] Kyushu Electric Power Company, “Electricity Statictics Information”, http://www.kyuden.co.jp/wheeling_disclosure.html (Japanese) [Accessed August 2019]
[19] OCCTO, “Operation plan for cross-regional interconnectors”, https://www.occto.or.jp/renkeisenriyou/oshirase/2018/files/2019_2028_unyouyourou.pdf (Japanese) [Accessed August 2019]
[20] IRENA, “Electricity storage and renewables”, https://www.irena.org/-/media/Files/IRENA/Agency/Publication/2017/Oct/IRENA_Electricity_Storage_Costs_2017.pdf [Accessed August 2019]
[21] Federation of Electric Power Companies, “Hand Book of Electric Power Industry, 2016” (Japanese)
[22] METI, “Current status for nuclear power plants in Japan”, https://www.enecho.meti.go.jp/category/electricity_and_gas/nuclear/001/pdf/001_02_001.pdf (Japanese) [Accessed August 2019]
[23] Kyushu Electric Power Company, “Electric power generation operation in each source for a day”, http://www.kyuden.co.jp/effort_water_omarugawa_omaru04.html (Japanese) [Accessed August 2019]
[24] OCCTO, “Grid Information Service”, http://occtonet.occto.or.jp/public/dfw/RP11/OCCTO/SD/LOGIN_login# (Japanese) [Accessed August 2019]
[25] Chugoku Electric Power Company, “Electricity Statictics Information”, http://www.energia.co.jp/retailer/eria_jyukyu.html (Japanese) [Accessed August 2019]
[26] JEPX, “Transaction Result”, http://www.jepx.org/market/index.html (Japanese) [Accessed August 2019]

Received: 11 November 2019/ Accepted: 26 December 2019/ Published: 25 February 2020
 Shota Ichimura
s.ichimura@renewable-ei.org
2096-5117/© 2020 Global Energy Interconnection Development and Cooperation Organization.Production and hosting by Elsevier B.V.on behalf of KeAi Communications Co., Ltd.This is an open access article under the CC BY-NC-ND license (http: //creativecommons.org/licenses/by-nc-nd/4.0/ ).
Biographies
Shota Ichimura received his bachelor and master degree at Tokyo University of Science in 1999, and 2001, respectively.In addition to research and development on submarin e fiberoptic cable, he worked for a communications company and a power cable manufacturer, and has led international projects including installation of submarine fiber-optic cable and power cable.His research interests include route design and cost analysis for interconnector.
(Editor Chenyang Liu)
