1 Introduction
Solar photovoltaic (PV) power is becoming the most promising source of energy.In 2011, the Algerian government launched an ambitious green energy program for the development of renewable energy (RE) and energy efficiency improvements, which as detailed in the strategic vision, will focus on the development of inexhaustible resources and aim to diversify energy resources and foreign trades.Through this program, the country intends to install nearly 22 GW of renewable energy by 2030, whereby around 40% of the electricity produced for domestic consumption will come from renewable sources.Unfortunately, this prosperous goal shrinked because of the world economic crisis down to 6 GW instead of 22 GW.By 2020, 60 solar PV and solar thermal power plants, wind farms, and hybrid power plants are intended to be in various stages of planning and construction.
Of course, the southern part of the country is the most suitable for such applications because of the high insolation level.However, the Sahara is the world’s largest hot desert and one of the harshest environments on the planet; its northeasterly winds can reach hurricane level and often give rise to sand storms and dust devils.The desert areas have less than 250 mm of rainfall per year, and the precipitation is occasional and unreliable.Such climatologic phenomena could have drastic effects on PV system performances in the region.In particular, soiling and dust are known to significantly impact the optical efficiency of PV systems [1].Dust and sand deposition on PV panel surfaces may be uniform or non-uniform depending on the panel dimensions, tilt angle, and wind velocity.Additionally, even though ambient wind and rainfall are thought to be natural cleaners, sometimes, to the contrary, it has been shown that successive dusty winds followed by scattered showers can affect the system performances drastically.Experimentally, it has been shown that high wind speeds increase the tendency of dust deposition on PV surfaces [2].Moreover, this work focused on the aging effect on PV modules after 5 years of exposure in the Saharan environment.Therefore, it is of essence to investigate the influence of each parameter by taking into account weather conditions to comprehend the losses in performances.Such research could show the enormity of the problem of dust deposition and heating effects in terms of potential energy delivery losses to the grid and help with estimating economic losses to the power plant.Moreover, these types of data are necessary for the development of appropriate mitigation strategies [14].
2 Experimental site description
In this study, a performance analysis is undertaken on an experimental grid connected PV system situated at Biskra University, within a semi-arid zone in southeastern Algeria.The test rig consisted of forty 85-Wp PV modules coupled to an INGECON SUN 5.0 inverter.Modules were assembled in 10 panels of four series connected modules each.In order to carry out different tests, the PV field was split into two sets of five series connected panels that could be used separately or grouped through a specially designed switch control board, as shown in Fig.1.Subsequently, various experimental tests were undertaken, including:
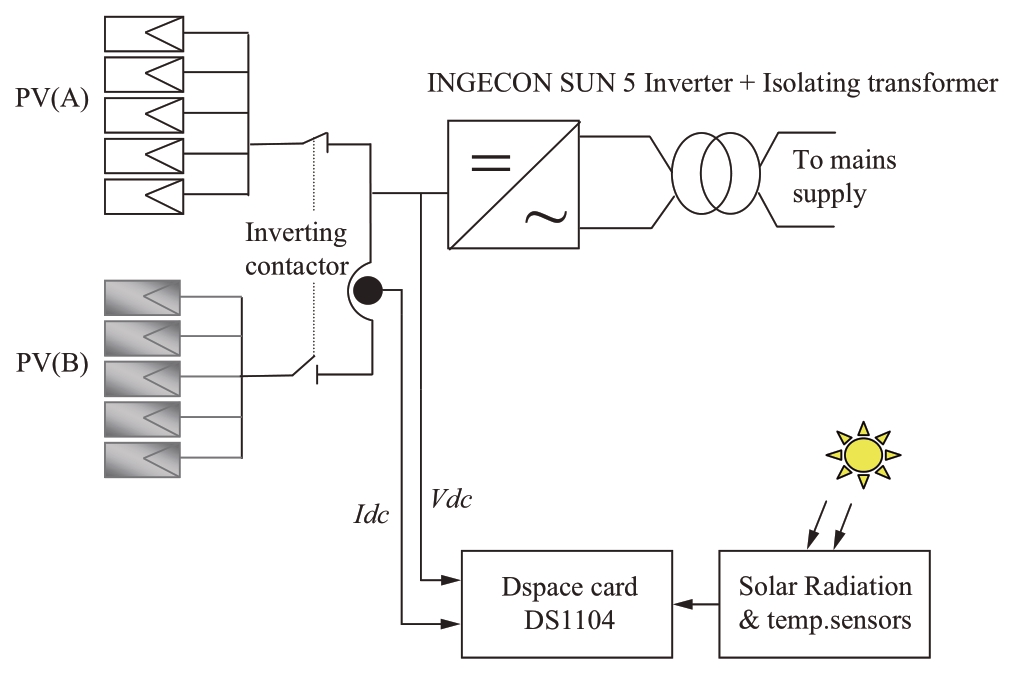
Fig.1 Schematic of the experimental system
· Tests on separate PV panels showing the effect of pollution under different climatic conditions;
· Tests on the effect of aging on PV panel power output;
· Tests on the effect of seasonal temperatures on PV panel power output;
· Determinations of grid connected harvested power under clean and polluted PV panels.
It is worth mentioning that during tests, the dirt accumulation composition was mainly of a soiling from dust particles present in the air and that due to the rain before the start of tests; this dust formed a thick caked layer of mud.
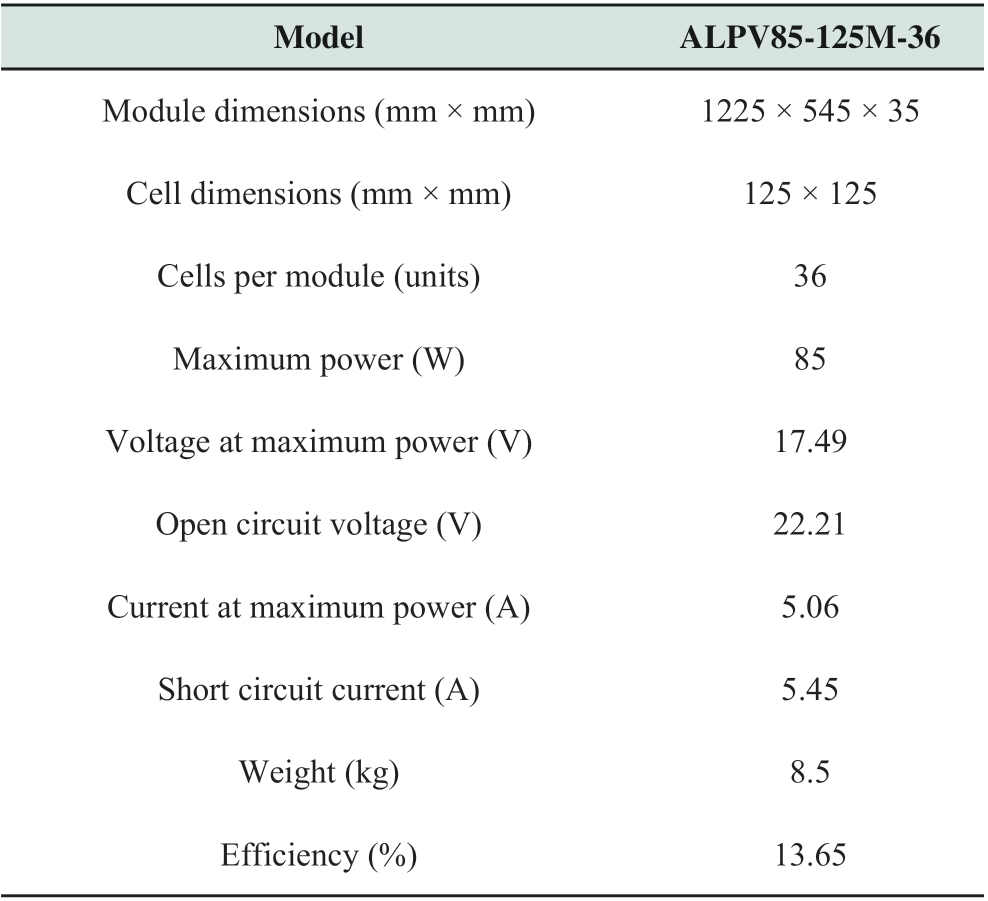
The specifications of the mono-crystalline PV panels used for this study are listed in Table 1.
The direct impacts of these parameters on the PV system performance were gauged by a comparison of the currentvoltage (I-V) and power-voltage (P-V) characteristics of the panels, and these characteristics can be considered the “fingerprint” of the PV element under study; this comparative approach has been adopted in the present study to investigate the influence of dirt and aging effect on PV operating characteristics for different climate conditions at different periods of the year.

Fig.2 Polluted and clean solar modules
3 Experimental tests and results
3.1 Effect of dirt on variations in the conversion coefficient of modules
The impact of dust on the performance characteristics of the modules was studied, and we used conversion coefficients for the performance evaluation.The conversion coefficients for the modules were calculated by the following equation:where Pmax (W) is the maximum power output, S (m2) is the surface of the module, and E (W/m2) is the Sun’s radiation.
Table 2 below shows the calculations results for the conversion coefficients for the clean and dirty modules (E = 730 W/m2) as well as for the modules tested under the standard test condition (STC) (E = 1000 W/m2).
Table 1 Conversion coefficient calculations
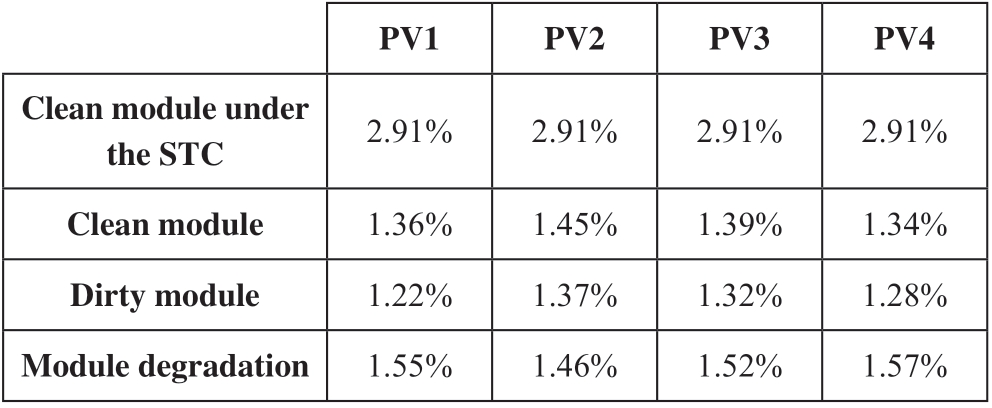
We acknowledge that the conversion coefficient measured on the clean modules decreased by 1.55%, and this was due to the natural degradation in properties (absorption, transmissivity) of the glass and the encapsulant of the module [15].The reduction in the conversion coefficient between clean and dirty modules varied between 0.06-0.14%.Thus, the dirt had an impact on the PV performance.
3.2 Effect of dirt on I-V and P-V characteristics
In the first test, the effect of a particular polluting event was investigated by comparing the I-V and P-V characteristics of a specific panel while keeping all ambient factors the same except for the pollution level in our case; this enabled the isolation of the influence of that particular factor on system performances.
Table 2 Panel specifications
This comparative approach has been adopted previously to investigate the influence of dirt deposition on PV operating characteristics [3, 4].Tests were done on four identical panels in both states, namely, “clean” and “dirty.”
With respect to the local climate for the specified period where the tests were carried out, the region is characterized by very hot and dry summers and mild winters; the city’s light rainfall of 129 mm (5.1 in) is spread fairly evenly over the rest of the year.Temperatures average 11 °C in January and can exceed 45 °C in July.
The main deposition dirt is a mix of dust, soil, and sand, as shown in Fig.2.For each panel, characteristics were recorded instantaneously for the dirty and cleaned one.The recording time was supposedly too short for the climate conditions to have varied.Figure 3 shows the I-V and P-V characteristics for panel 1 collected experimentally by using a digital storage oscilloscope under both conditions.Actually, all of the results for the remaining panels 2, 3 and 4 are experimental ones, and these data were taken at different levels of dust deposition at the same temperature and amount of solar radiation.
For each case, the dirt particles collected from each panel were weighed.Table 2 summarizes the experimental results for each panel (1, 2, 3, and 4) in terms of the dirt deposition density and the corresponding maximal power output for the clean and polluted case.Power losses are also depicted with respect to the clean state.
It would be judicious to show graphically the power losses and dirt accumulation dependency.Hence, Fig.4 illustrates the relationship between the density deposition of the obstructing dirt accumulated on the panel and the power loss proportion.These data should be taken into account when designing the dimensions of solar PV plants.From the recordings and the graphs, the following observations can be drawn:
· As may be noted in the graphs, dirt deposition did not have a real large influence on the open circuit output voltage; however, it had a significant effect on the shortcircuit current and decreased the maximum power point.The dirt density varied between 1.19 and 2.72 mg/cm2 in this study, as shown in Table 2, and the corresponding worst case maximum power loss ranged up to 10.27%.
· Generally, dust induced no uniform shading on the surfaces of PV modules and thereby chains of PV cells were not illuminated with the same intensity.Therefore, they did not show the same behavior and the I-V and P-V characteristics became modified [5].
· The solar modules’ performances depended on the particles nature, weight, and dirt accumulation degree on the module.Such results suggest that feasibility studies of clean-up mechanisms and the development of appropriate cleaning schedules would be valuable.
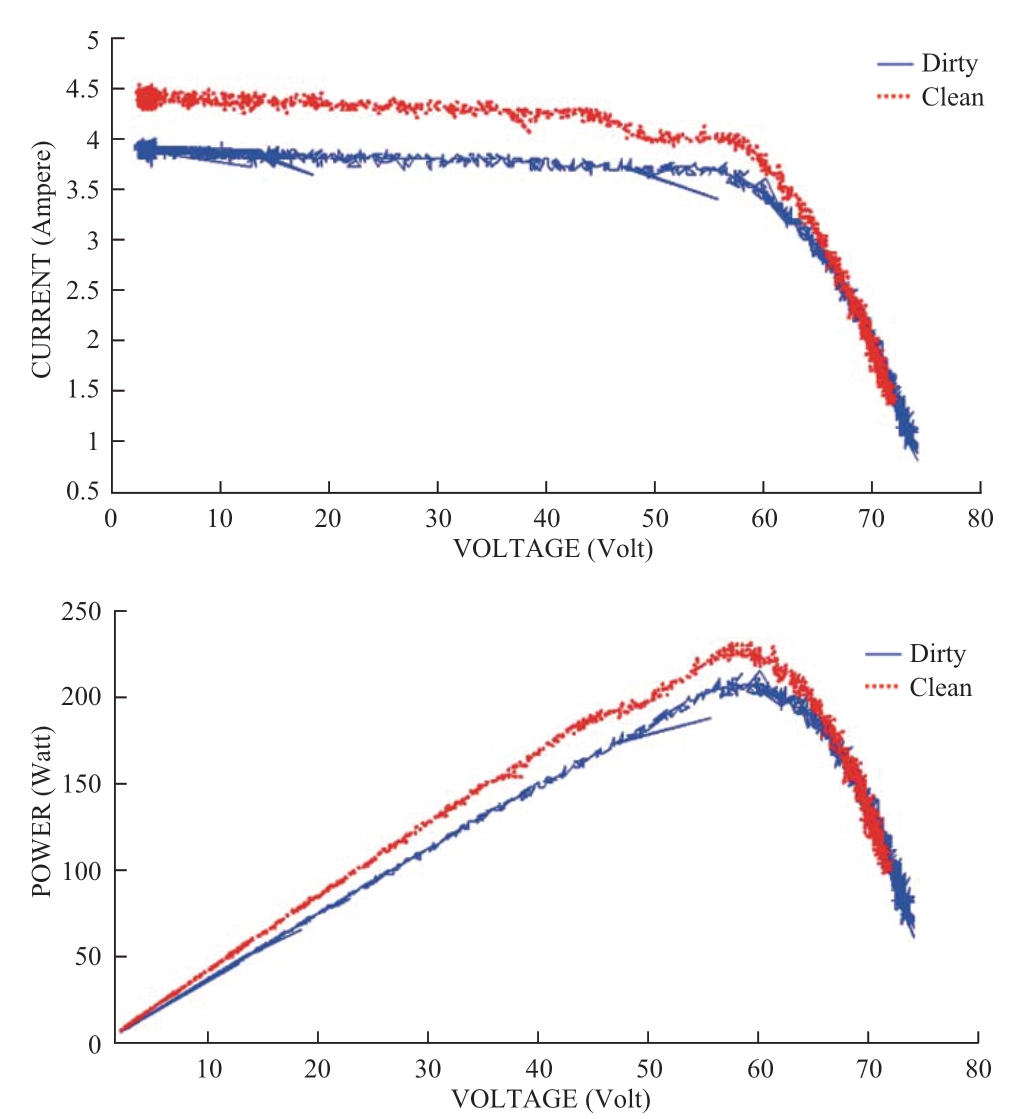
Fig.3 PV panel-1 I-V and P-V characteristics at E = 730 W/m2, T = 34 °C
3.3 Modeling the impact of dust density on the
power loss characteristics of the PV modules
We attempted to find the most appropriate correlation between the power variation of the modules and the dust density, as shown in Table 3; importantly, there was a relationship between the power loss and dust density.In order to study the correlation that exists between the power loss variation and dust density, we evaluated the best equivalent regression methods, and in our case and for this type of performance parameter (power loss), we selected a polynomial regression; this type of regression was previously found to be an appropriate method for power loss performance parameter assessments [13, 20].Then, the impact of dust density on the variation of power loss was determined by the following polynomial equation [17-22]:
3.4 Effect of aging on the performances of the PV modules
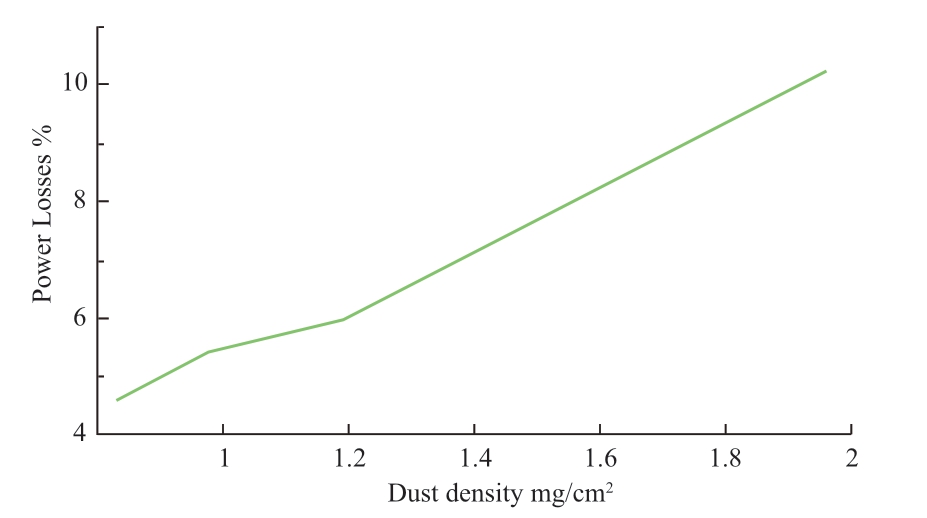
Fig.4 Power losses versus dirt density deposition relationship
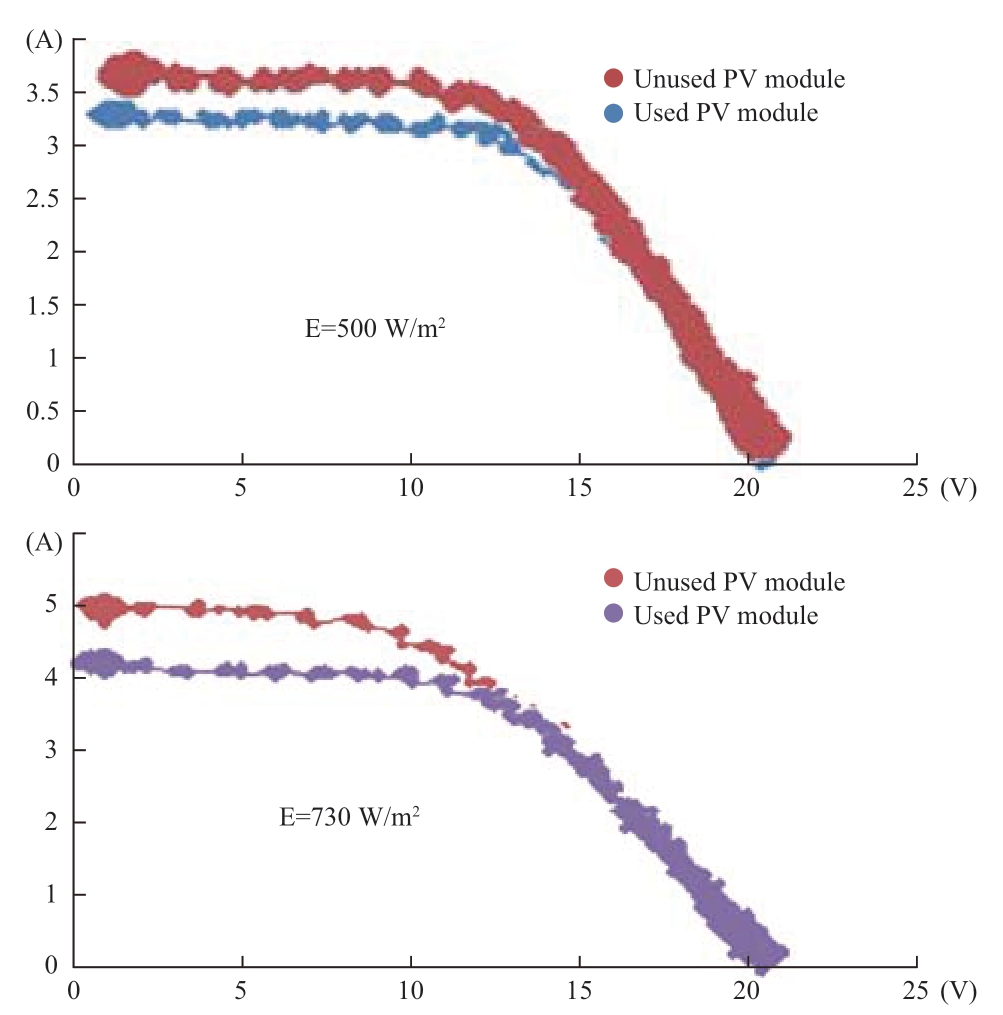
Fig.5 Effect of aging on I/V characteristics after 5 years of use for E = 500 W/m2 and E= 730 W/m2
The grid connected PV station was set up in 2012.After 5 years of direct exposure to extremely high temperatures and occasional sandstorms, the PV module coatings and solar cell characteristics would be affected [11-12].A comparative study was carried out by using similar modules kept in storage.Electrical characteristics were taken for both modules at different levels of solar radiation and temperatures, and these results are illustrated graphically in Fig.5.It can be clearly seen that the power losses were about 5%, which agrees with most published literature.This diminishing power output should be taken into account for long-term use [18, 19].
3.5 Performance analysis of the grid connected PV system under clean and polluted conditions
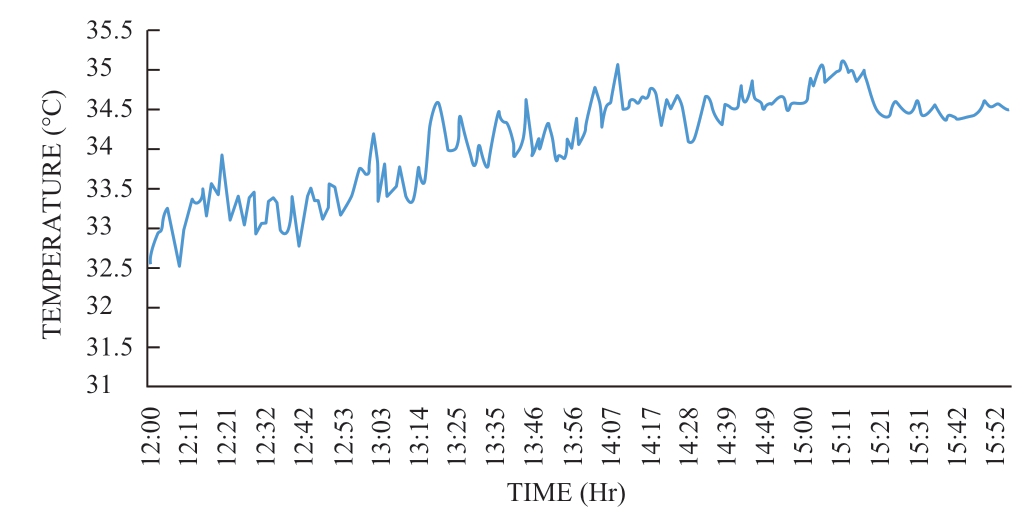
Fig.6 Ambient temperature variation

Fig.7 Solar radiation variation
In this test, harvested power under clean and polluted PV panels is investigated.The system shown in Fig.1 was used.The two sub-fields mentioned earlier were placed on the grass in an open area at a 34° tilt angle, facing the south.Modules were connected to an INGECON SUN 5.0 inverter, which was coupled to the mains supply.The first set of PV sources was maintained in a clean state all of the time; however, the second one experienced naturally varying weather conditions characterized by a sandstorm followed by scattered showers, which allowed us to examine the effect of each weather situation on the PV system performances.Figs.6, 7, and 8 show the ambient temperature, solar radiation, and AC power output fed to the mains supply generated by the two sub-fields, i.e., the clean and polluted ones.Fig.9 shows a zoomed in capture of the small area of the former plot, and one can see the difference between both power outputs, which could exceed 20 W.
3.6 Effect of seasonal temperature on the power output of the PV panel
It is well known that the temperature of a cell affects its energy yield tremendously.Practically, it was found that the PV cell temperature rise over the ambient temperature was extremely sensitive to the wind speed (cooling effect) and relatively less insensitive to the atmospheric temperature [6].On the other hand, the temperature obviously depends strongly on the impinging irradiation.
Table 3 Dirt deposition and power output on each panel
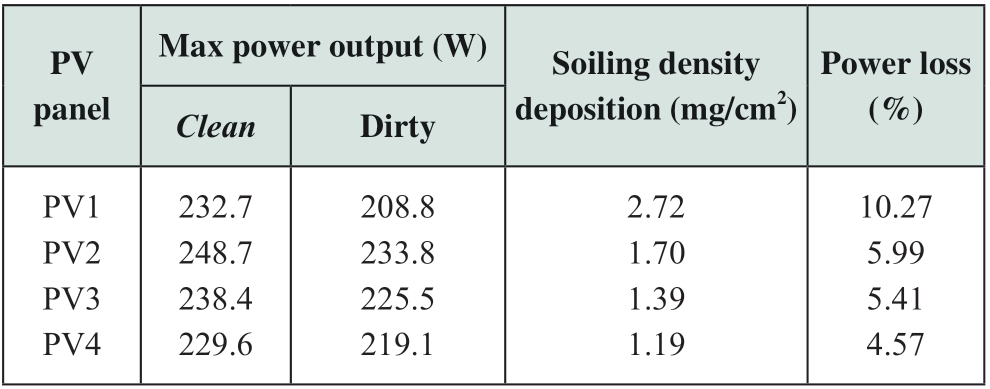
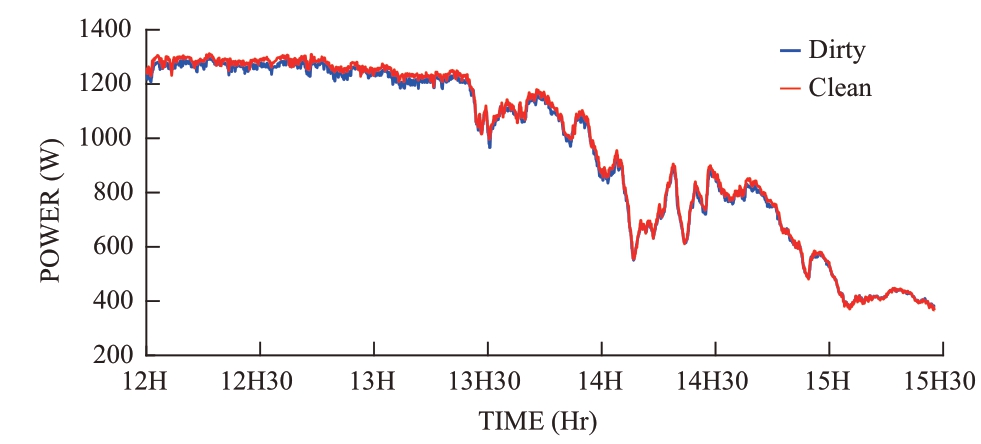
Fig.8 PV power injected to the mains supply
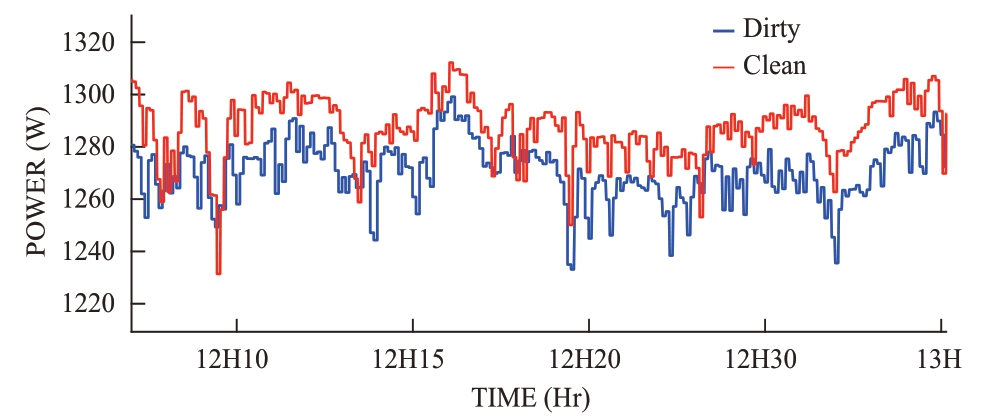
Fig.9 Zoom of the power output difference
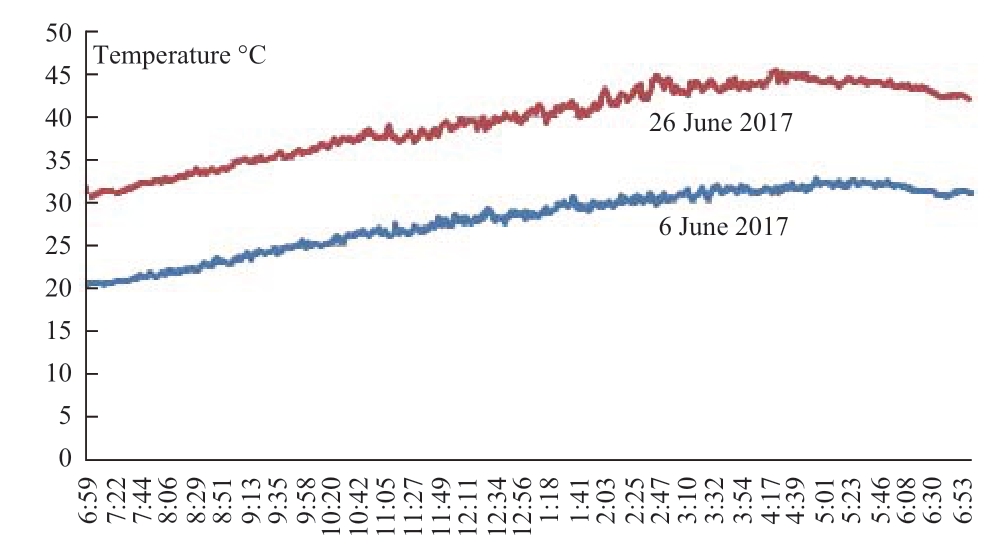
Fig.10 Temperature variation
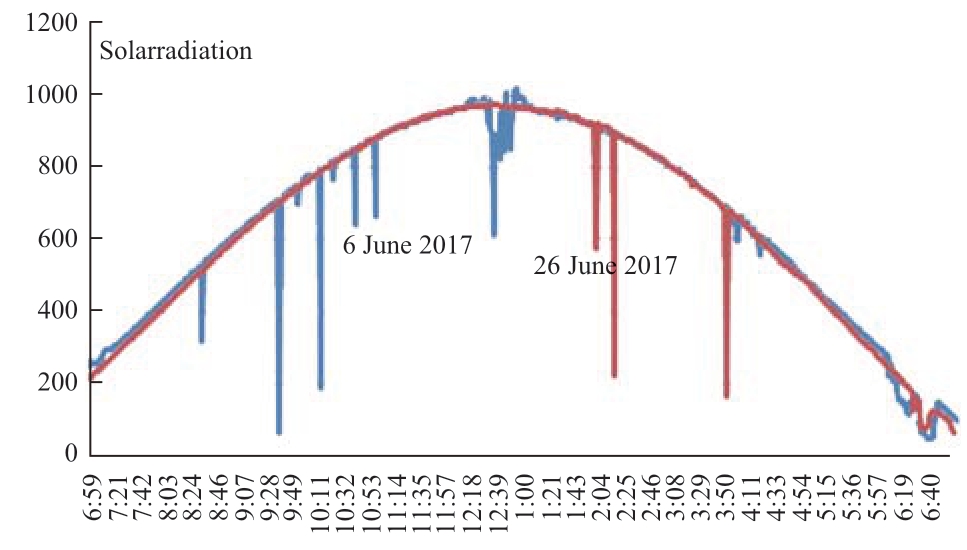
Fig.11 Solar radiation variation
With respect to solar cell types, PV modules convert certain proportions of the incident solar radiation into electricity, whereas the rest is converted into heat.This will significantly increase the temperature of the PV module and reduces its efficiency.Tests were taken on the 6th and 26th of June 2017, and the daily temperature variation, solar radiation, optimal voltage, and optimal current were recorded; the measured data are plotted in Figs.10, 11, 12, and 13, respectively.
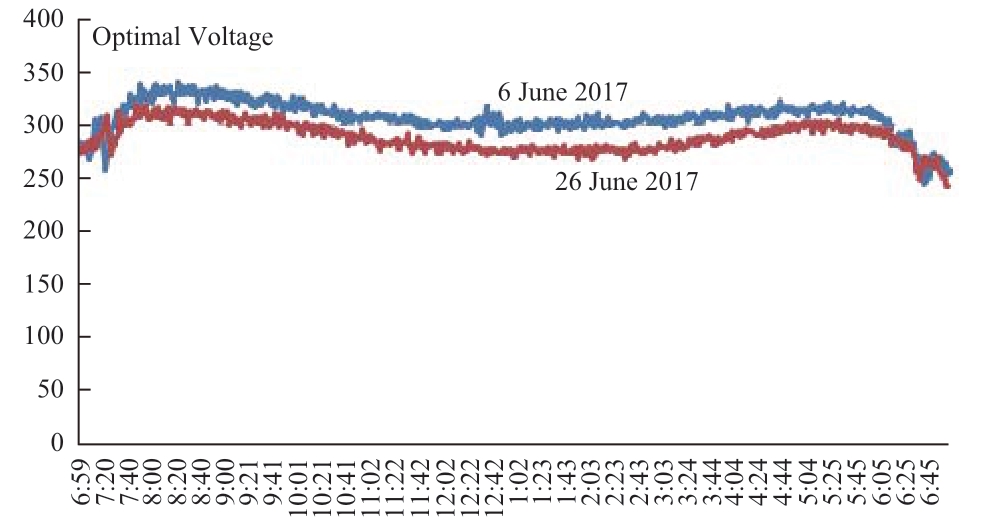
Fig.12 Optimal voltage variation
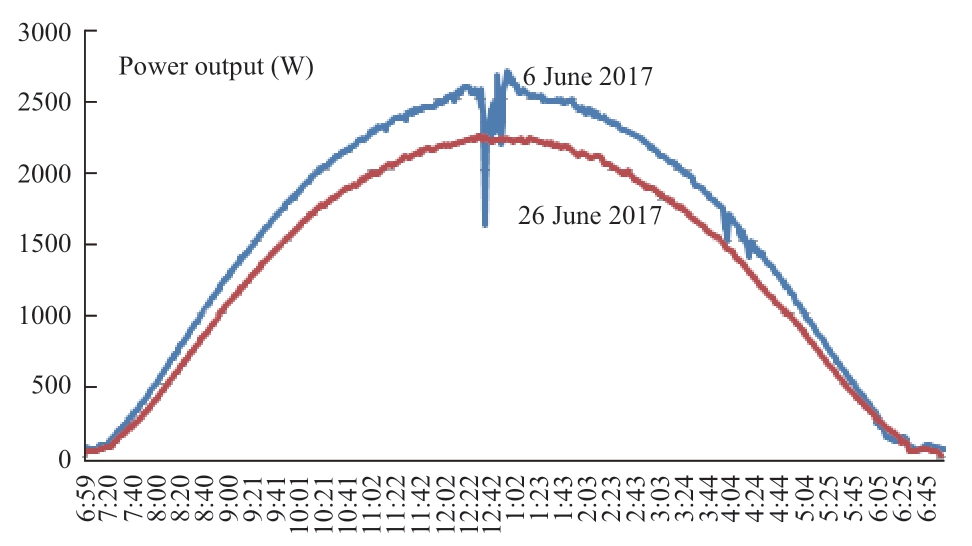
Fig.13 Output power variation
Fig.13 shows the power output for different ambient temperatures but the same levels of solar radiation and wind speed (data not shown here), as given in Figs.10 and 11.It can be seen that the heating effect was accentuated at midday when the incident solar beam was perpendicular to the solar panel, thus reducing the optimal voltage value.In addition, for the same solar radiation, the optimal voltage was clearly different if the temperature varied for the two designated days.Additionally, this effect was also observed on each of the curve extremities because the temperature rose in the morning from 20 °C (30 °C) to 33 °C (45 °C), thus leading to further reductions in the optimal voltage value.
4 Discussion
The tests carried out previously revealed that opposing effects influence the final results as follows:
· Increasing solar radiation would normally increase the optimal voltage with regards to the cell model.However, this increase will boost the internal solar cells’ temperature, which will decrease the optimal voltage.
· Practical results showed that the heating effect of solar radiation is much greater than the current source outcome.At maximum solar radiation values, power losses reached 350 W (380 W), i.e., approximately 13% of the presumed value if the solar panel is kept at ambient temperature (Fig.13).
· It can be seen that the minimum value of optimal voltage does not coincide with the maximal value of solar radiation; it is slightly shifted to the right due to the continuing increase in ambient temperature (Figs.10 and 12).This reflects the combined heating effect of both the ambient temperature and solar radiation heating effect.
· In addition, one can see that the ambient temperature had little effect on the power output, but for large-scale systems, this should be taken into account.
From the previous results discussed, the following observations can be drawn:
· The fluctuation of power output for clean or dirty modules is solely affected by the ambient temperature and solar insolation level.
· Dust deposition obstructs solar radiation and prevents it from reaching solar cells, thus reducing the solar current.Additionally, the temperature elevation has a double effect by increasing the solar current slightly and reducing the optimal voltage value considerably, which results in a net reduction in the output power [10, 16].
· The combined effect of dirt deposition and a rise in cell surface temperatures further deteriorates the system performance [6].In this study, the dust deposition effect as well as ambient temperature, solar radiation heating, and aging effects were observed; power output was affected considerably by mainly the solar radiation effect, dust effect, ambient temperature, and aging effect successively.
· The practical results were compared with theoretically expected ones while taking into account manufacturer data on the aging effect, which amounts to about a 1% decrease per year [7-8]; a perfect match was obtained.
5 Conclusion
The present study was conducted to gain preliminary insight into the behavior of a grid connected PV station and observe the influence of climatic conditions and site properties on the system performance.This study investigated the effect of pollution on panel performance by obtaining I-V and P-V characteristics of identical panels subjected to the same climatic conditions and different quantities of dirt deposition, and a comparative analysis of the performance curves led to an understanding of the relation between the power loss and dirt accumulation on photovoltaic surfaces.A linear relationship was found.Therefore, it is essential to use an auto cleaning mechanism to remove the polluted particles from the surface of the panels in order to ensure high performance.The cleaning procedure and cleaning schedule will depend on the geographical region and climate properties.The second test showed the heating effect of solar radiation and seasonal ambient temperature.The former reduced the system efficiency excessively and may warrant a cooling procedure.This, of course, will depend on the site position, wind speed and direction, and temperature.
During the second term, an experimental test was performed at the PV field station and results confirmed that the PV power performances are affected by the particle weights of the dirt and climatic conditions; hence, we can deduce that in desert regions, the electrical power loss can reach as much as 30% if cumulative losses are considered:
- Aging effect;
- Seasonal temperature variation;
- Heating effect of solar radiation;
- Dust and soiling effect.
Thus, in severe weather conditions, these parameters should be taken into consideration while sizing the system in order to avoid any deficiencies in the power demand.In general, cleaning and cooling represent obvious ways to improve the system performances [21].
References
[1] M.Mani, R.Pillai, “Impact of dust on solar photovoltaic (PV) performance: Research status, challenges and recommendations”, Renewable and Sustainable Energy Reviews, 2010, 14(9): 3124-31
[2] A.Rao, R.Pillai, M.Mani, P.Ramamurthy, “An experimental investigation into the interplay of wind, dust and temperature on photovoltaic performance in tropical conditions”, Proceedings of the 12th International Conference on Sustainable Energy Technologies, 2013: 2303-2310
[3] A.Rao, R.Pillai, M.Mani, P.Ramamurthy, Influence of dust deposition on photovoltaic panel performance.Proceedings of the 4th International Conference on advances in Energy research; 2013:1876-6102
[4] A.Darwishz, A.KazemH, K.Sopian, M.A.Alghoul and Miqdam; T.Chaichan, “Impact of Some Environmental Variables with Dust on Solar Photovoltaic (PV) Performance: Review and Research Status”, International journal of energy andenvironment,2013:issue 4,Volume7
[5] A.Ndiaye, C.M.F.Kébé, P.A.Ndiaye, A.Charki, A.Kobi and V.Sambou, “Impact of dust on the photovoltaic (PV) modules characteristics after an exposition year in Sahelian environment: The case of Senegal”, International Journal of Physical Sciences, 2013: 1166-1173
[6] K.Al khuffash, L.A.Lamont, L.El chaar, “Analyzing the effect of desert environment on the performance of photovoltaics”, Direct conversion of solar energy to electric energy,2014:215-220
[7] C.Dirk, Jordan and Sarah, R.Kurtz, “Photovoltaic Degradation Rates — An Analytical Review”, Journal Article NREL/JA-5200-51664 June 2012
[8] E.Kaplani, “Degradation Effects in sc -Si PV Modules Subjected to Natural and Induced Ageing after Several Years of Field Operation”, Journal of Engineering Science and Technology, Review.5 (4) (2012) 18-23
[9] Sanaz Ghazi, “The effect of weather conditions on the efficiency of PV panels in the southeast of UK” Renewable Energy, Volume 69, September 2014, 50-59
[10] J.Tanesab, D.Parlevliet, O.Whale, “Seasonal effect of dust on the degradation of PV modules performance deployed in different climate areas” Renewable EnergyVolume 111, October 2017, 105-115
[11] F.Bandou, A.HadjArab, M.Saïd Belkaid, P.Olivier Logerais, “Evaluation performance of photovoltaic modules after a long time operation in Saharan environment” International Journal of Hydrogen Energy, Volume 40, Issue 39, 19 October 2015, Pages 13839-13848
[12] Bing Guo; W.Javed; B.W.Figgis; T.Mirza, “Effect of dust and weather conditions on photovoltaic performance in Doha, Qatar” 2015 First Workshop on Smart Grid and Renewable Energy (SGRE)
[13] Ababacar Ndiaye , “etude de la dégradationet de la fiabilité des modules PV-impact de la poussiere sur les carracteristiques electriques de performance” 2013 these de doctorat ESP,UCAD
[14] Houssain Zitouni,Ahmed Alami Merrouni, “investigation of the soiling effect on the performance of monocrytalline photovoltaic systems”,Energy procedia.157(2019)1011-1021
[15] Loic Mabille, “Vers la comprehension des mecanismes de dégradation et de veillissement des assemblages photovoltaiques pour des applications sous haute concentration,HAL :tel-00985464.2014
[16] S.Fadhel,C.Delpha,D.Diallo, “PV shading fault detection and classification based on I-V curve using principal component analysis:Application to isollated PV systems”,Solar Energy 179(2019)1-10
[17] IEA,2014-Review of failures of photovoltaic modules, PVPS T 13-01,ISBN978-3-906042-16-9
[18] A.Azizi, P.O.logerais, A.Omeiri, A.Amiar, A.Charki, O.Riou, F.Delaleux,J.F.Durastanti, “Impact of the of the aging of photovoltaic module on the performance of a grid-connected systems”,2018, Solar Energy 174,PP.455.454
[19] B.Nehme, N.K.M.Sirdi,T.Akiki, A.Naamane, “Contribution to the modeling of ageing effects in PV cells and modules”, Energy Procedia62(2014)565-575
[20] Ababacar Ndiaye, “Etude de la degradation et la fiabilité des modules photovoltaiques-impact de la poussiere sur les carracteristiques electriques de performance”, 2016 HAL.Id :tel-01250271
[21] Thomas Mambrini, “Caracterisation des panneaux solaires photovoltaiques en condition et en fonction des differentes technologies”, 2014 these de doctorat LGEP,France
[22] M.Kontages,S.Kurtz, C.Packard, “Review of failures of photovoltaic modules,Report IEA-PVPST13-01.2014
[23] A.Kumar Tripathi, M.Aruna, Ch.S.N.Murthy, “Output power loss of photovoltaic panel due to dust and temperature”,international journal of renewable energy research, 2017,Vol7,No1
[24] F.Mani,S.Pulipaka,R.Kumar, “Characterization of power losses, of a soiled PV panel in Shekhawati region of india”, june 2016, Volume 131, pages 96-100


Received: 2 November 2019/ Accepted: 12 December 2019/ Published: 25 Feburary 2020
 Ammar Moussi
moussi_am@hotmail.com
Meriem Memiche
mami_psn85@hotmail.fr
Chaima Bouzian
chaima_bouziane@hotmail.com
Ayoub Benzahia
ayoub.benz@hotmail.com
2096-5117/© 2020 Global Energy Interconnection Development and Cooperation Organization.Production and hosting by Elsevier B.V.on behalf of KeAi Communications Co., Ltd.This is an open access article under the CC BY-NC-ND license (http: //creativecommons.org/licenses/by-nc-nd/4.0/ ).
Biographies
Meriem Memiche received her master’s degree in Renewable Energies from Skikda University, Algeria, and since then, she has worked as an instrumentation engineer at the Oil and Gas Company.She is a member of the LARHYSS laboratory and currently is preparing for her doctorate degree.Her research interests include solar power applications and fault diagnostics.
Chaima Bouzian received her bachelor’s degree in Electrotechnics in 2014 and master’s degree in Renewable Energy from the University of Biskra, Algeria, in 2016.Currently, she is working as a production technical manager at a plastic factory.Her research interests include solar power applications and recycling.
Ayoub Benzahia received his bachelor’s degree in Electrotechnics from Msila University and master’s degree in Renewable Energies from Biskra University, Algeria.Currently he is preparing for his doctorate degree.His research interests include power quality improvements and solar energy applications.
Ammar Moussi received his Ph.D.degree from the University of Nottingham, UK, in 1991.Since that time, he has worked at the Electrical Engineering Department at Biskra University, and he headed that department during 1997-2001.He is a member of the LARHYSS laboratory.His research interests include power electronics, electric drives, and renewable energies.He is currently a member of the Algerian parliament, a member of The Parliamentary Assembly of the Mediterranean (PAM), and member of the executive bureau of the Arab Renewable Energy Commission (AREC).
(Editor Zhou Zhou)
