1 Introduction
Effective share of renewable energy resources including hydro, wind and solar energy in wide-area is crucial for realizing low-carbon and sustainable development of the world in the future [1-7].There are several important benefits of cross-border grid interconnection, such as: (1) take advantage of the complementary natural features of renewable energy resource in different countries; (2) effective use of large economical power plant including hydro power plants; (3) sharing generating reserves; (4) reduction of customer payment due to more use of cheaper generation; (5) lower carbon emissions.
Hydro energy resource is one of the most important renewable energy resources.Around the world, there are regions with abundant hydro energy resources that are utilized or can be potentially developed for hydropower generation.For instance, the hydropower potential in south America is about 600 GW [8], among which Brazil has about 260 GW and only 35% of it has been developed; Argentina has about 40 GW and only 25% of it has been developed.And the features of the hydro energy in these two countries show significant seasonal complementarity.In such cases, cross-border grid interconnection could help make best use of the hydro energy in both countries and reduce the overall production cost as well as customer payment and carbon emission.However, limited crossborder transmission capacity would hinder the achievement of such benefits.This could be solved by transmission upgrades, but with costs.Therefore, during the early stage of cross-border grid interconnection planning, economic benefit is the most important factor for decision-making.A comprehensive economic evaluation of transmission upgrades should be made to quantify the problems, such as, how severe the bottleneck is, how much more cheaper resources can be used, what the optimal transmission capacity is, etc.
Transmission planning is a traditional research area.Different methods, such as heuristic methods, probabilistic methods, and classic optimization methods have also been used for market-based or utility-based transmission studies [9-12].Recently, researches focusing on cross-border transmission planning have also been made.A planning method of crossborder transmission considering country risks and a model quantifying the risk factors were proposed in [13].A multiperiod planning model of global power flow based on time series scenarios considering system planning and operation constraints was proposed in [14].Several scenarios of HVDC application in cross-border grid interconnection were introduced and a DC grid was designed [15].Along with the needs of massive expansion of renewable generation, transmission planning should also carefully consider related matters.A method was proposed for balancing the cost of relying on expensive reserve resources and the cost of building new lines to ensure least-cost reserve delivery and foster new renewable projects [16].A two-stage style="font-size: 1em; text-align: justify; text-indent: 2em; line-height: 1.8em; margin: 0.5em 0em;">In this paper, a method based on cost-benefit economic assessment for optimal planning of cross-border grid interconnection is proposed.Firstly, an economic index for comprehensively assessing the cost of a transmission project and its resulting benefits of more usage of hydro energy is designed.Secondly, a chronological production cost simulation model considering hydro energy spillage due to transmission congestion and thermal operational limitation is proposed to calculate the economic index.Finally, a case study for determination of the optimal capacity of a potential transmission link between Brazil and Argentina is performed under a hypothetical scenario for the future power system to illustrate the use of the proposed method.
2 Economic index and assessment procedure
2.1 Economic index for hydro benefit
A cost-benefit analysis method is utilized to design the economic index for hydro benefit (HYB).
where  and
and represent hydro generation revenue for country r for the base case with existing congested transmission system and the case with transmission upgrade T, respectively.R represents the number of countries.
 is the annualized investment cost of the i-th transmission facility of transmission upgrade T.N represents the total number of transmission facility of transmission upgrade T.
The index reflects the total economic benefit specifically for hydro generation parties.Namely, when a new transmission system is upgraded, HYB is calculated for the increase of total hydro generation revenues of all countries in the studied regions for the scenario with and without the transmission upgrades.HYB also considers the overall cost of the transmission upgrades, since there could be significant investment difference for transmission upgrades, as well as its resulting benefits.Therefore, cost and benefit should be both considered in the index so that the net benefit can be evaluated.
The HYB index is calculated for a yearly basis, which is a summary of hydro benefit over the study year.The cost in HYB calculation is an annualized value of the total transmission investment.A transmission alternative planning should look ahead serval decades.Therefore, HYB index can be evaluated every 5 years, such as the 1st year, the 5th year, the 10th year, and so on.
2.2 Procedure of transmission upgrade optimization
Among all possible transmission upgrades, the optimal one should be found, namely, the one brings the most economic benefit for hydro generation.Typically, at the beginning of upgrading a congested transmission path, the economic benefit will rapidly increase.However, when congestion is mostly relieved, increase of cheaper generation resource usage will slow down and the benefits of transmission investment will decrease.Therefore, an optimal position theoretically exists for transmission upgrades, which represents the greatest value of HYB.
The procedure of transmission upgrade optimization includes the following steps: (1) calculate total hydro generation revenue (HYGR) of the existing power system, i.e., the Base Case; (2) identify the most congested transmission path contributing the limitation or spillage of hydro generation; (3) propose an alternative of transmission upgrade for the congested transmission, perform chronologic simulation to calculate total hydro generation revenue of the power system with the new transmission system; (4) calculate HYB for the new power system, compare with the HYB for other upgrade alternatives; (5) repeat step 2 to step 4 until the optimal transmission alternative with greatest value of HYB is found.The calculation formula of the HYB index for transmission alternative i (TAi) is given in equation (2).
where HYGRB is the hydro generation revenue for the base case, CTAi is the investment of transmission alternative i.
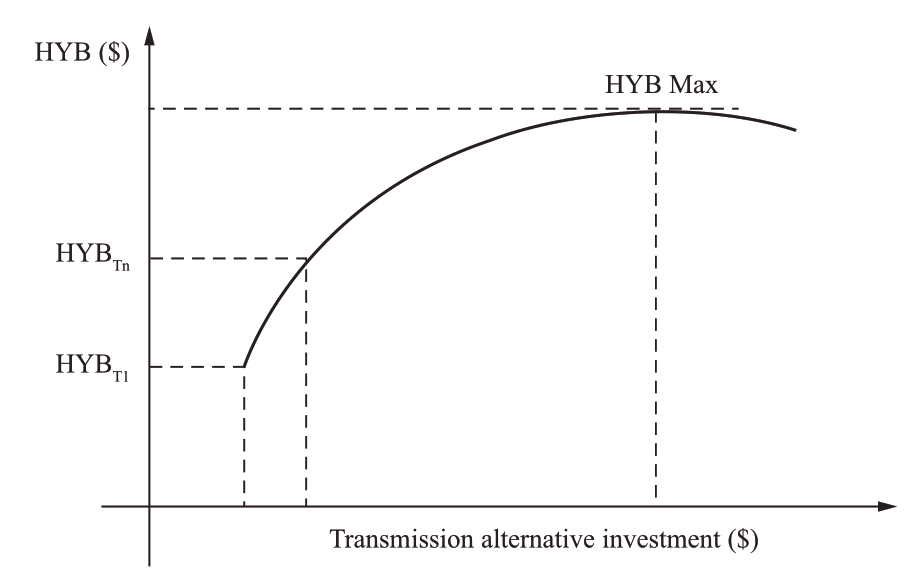
Fig.1 Conceptual relationship between transmission investment and hydro generation benefit
3 Production cost simulation considering hydro energy spillage
In order to quantify hydro generation revenue for the HYB index, a chronological production cost simulation needs to be established.A production cost simulation program including detailed generation and transmission models can simulate power system operation for certain time period.The core parts of the program are security constrained unit commitment and economic dispatch.
A production cost simulation model requires basic power system information for the inputs, including: (1) for generation units: installed capacity, location, heat rate, fuel type, fixed and variable cost, operational constraints, and characteristics for certain type of generator, etc.; (2) for transmission systems: interconnection topology, transmission facility limits and impedance, operational constraints, etc.; (3) for load: load distribution across the system, load profile over time; (4) other conditions: fuel price, hydro inflow, etc.
The overall procedure of production cost simulation is shown in Fig.2.For an economic assessment related with transmission upgrades, simulation is normally last for a year for fully covering the chronological characteristic of a power system operation.The simulation repeatedly performs dayahead unit commitment to determine the on or off status of all generators and intra-day economic dispatch to dispatch the online generators.After finish of simulation for all days, statistical analysis will be performed to obtain hydro generation revenue, hydro energy spillage and transmission congestion conditions.
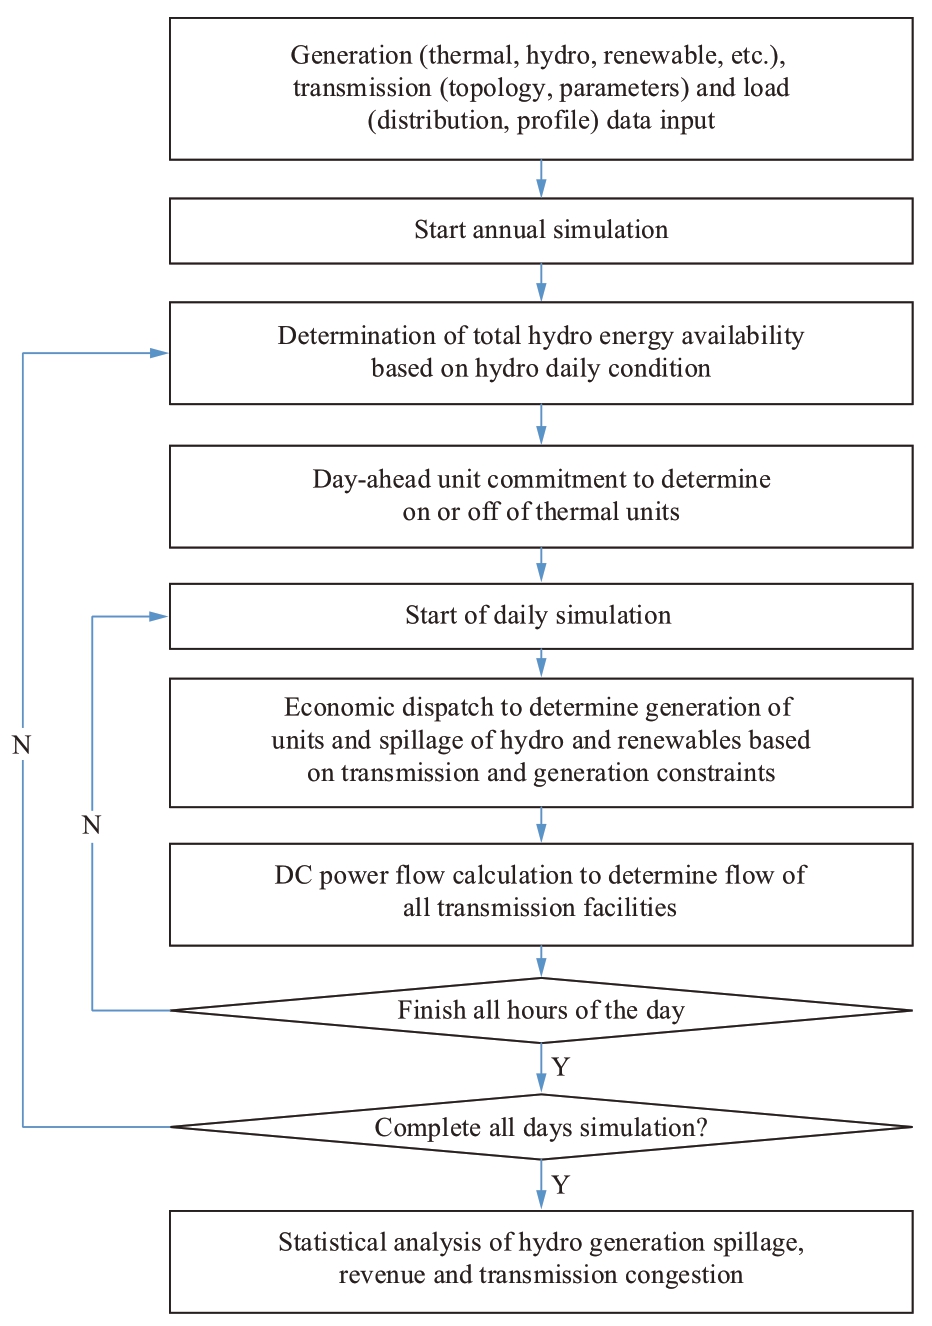
Fig.2 Procedure of chronological production cost simulation
For a simulation with hydro generation, the hydrologic feature must be considered.Different from thermal generation, hydro generation has limited energy resource highly depending on hydrologic condition.Typically, hydro generation operates in peak shaving mode during dry seasons and operates as base load generation during wet seasons.Therefore, based on hydrologic condition through the simulation year, at the beginning of daily simulation, total usable energy for each hydro plant should be determined.Daily energy of a hydro plant can be calculated by breaking down the monthly available energy that is mainly based on dry, normal or wet seasons, as well as the storage conditions of the hydro dams from upstream to downstream of a river system.
Day-ahead unit commitment determines the on or off status of a generator based on day-ahead load forecast, renewable generation forecast, hydro pre-scheduling, maintenance of transmission facilities and operational requirements, normally using mix-integer optimization program.Methods of unit commitment can be found in various researches [18].
The dispatch loop during a day should be able to closely mimic the actual system operation.For regions with rich hydro generation, spillage of hydro energy must be modeled, because it is possible that hydro energy can not be fully used due to transmission congestion or thermal operational limitation, such as minimum generation requirement to maintain the unit online for system security.Therefore, the generation dispatch optimization model is listed as follows for a system with thermal, hydro and renewable generators.
Objective function: the model minimizes the total operational cost of the system.

where, and
and are the variables for generation output of thermal, hydro and non-hydro renewable generator respectively.
 and Ch(
 ) are the production cost functions of thermal unit i, hydro unit j and renewable unit k.NTH, NHY and NRE are the number of units for thermal, hydro and renewable.
The energy balance constraint represents that the total generation of all units should be equal to the total load.
whe re, Dk, in MW, represents the bus load.NLD is the number of load bus.
Thermal unit operational constraints represent the maximum and minimum generation limits, as well as the ramp rate limits.

where, and
and , in MW, are maximum and minimum generation limit of thermal unit i.
 , in MW/min, is the ramp rate of thermal unit i.
Equation (7) represents hydro units generation limits.
where, is the maximum generation of hydro unit j.
Equation (8) represents the generation limits of renewable units.
Equation (9) represents the transmission limit constraint.The loading of a transmission facility can be represented as the summation of product of GSF and its associated active power injection at a bus.Equation (8) can be applied for all the transmission facilities with a flow limitation.

where, GSFl-i, GSFl-j, GSFl-h and GSFl-k represents the generation shift factor of transmission facility l to thermal unit i, hydro unit j, renewable unit h, load k.Fl,min and Fl,max are the loading limit of transmission facility l.
In the generation dispatch model, in equation (7), the hydro unit output variable is limited by a maximum value which is a pre-scheduled generation determined by a day-ahead hydro condition module.If there is no transmission congestion or thermal unit operational issues, hydro units will generate at value of , since mathematically, the optimization solver will choose the cheapest generating resource.However, if transmission constraint is limiting due to high contribution of hydro units, hydro units will reduce its output and spill water.The similar mechanism determining curtailment of non-hydro renewables can be found in equation (8).
4 Case study
A hypothetical power system including Brazil and Argentina in South America is studied for a future year.There are plenty of hydro generation resources across the river systems, such as Amazon, Parana and so on.The purpose of the study is to optimize the capacity of crossborder grid interconnection between the two countries in order to realizing better share of hydro energy.
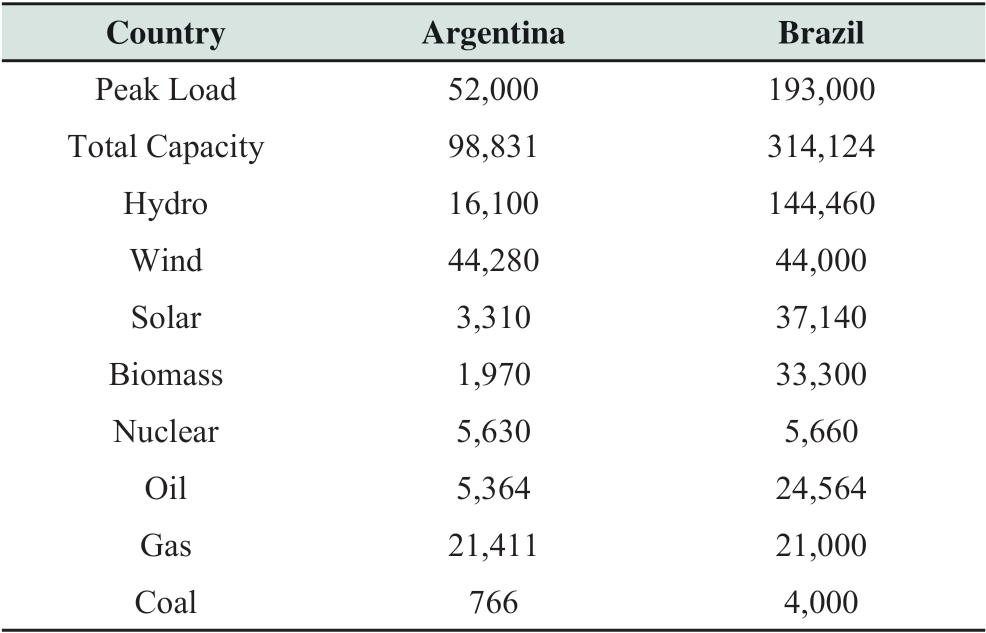
The forecasted installed capacities of different types of generation in the two countries are listed in Table 1.The hydropower installed capacity is large, accounting for 46% of the total generation capacity in Brazil.
Table 1 Installed capacity and peak load (MW)
Based on the forecasted hydrological characteristics of the river systems associated the hydro generators, monthly available hydro energy is estimated for the two countries, as shown in Fig.3.
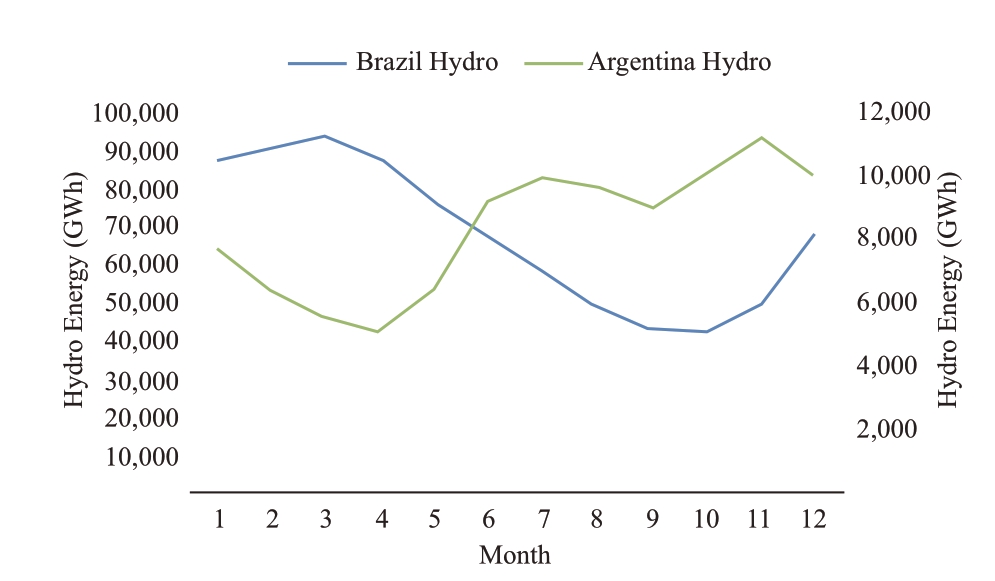
Fig.3 Monthly available hydro energy
The hydrologic conditions of two countries are very complementary.In the first half year, wet season exists in Brazil and dry season exists in Argentina, vise versa for the second half year [19].And there is an existing transmission link with a capacity of about 2,000 MW between Brazil and Argentina.Upgrading the transmission link will benefit for both two countries.
The chronological production cost simulation is performed for the 2-country system for the whole planning year.Results shows that the link is heavily congested for 7,273 hours out of 8,760 hours, namely, 83% of the time, which technically indicates there are strong needs for transferring energy between the two countries.And the thermal generators, including coal, gas, nuclear and biomass, output at their minimum generation limit for most of the time.The stack chart for different types of generation for Jan 1st is shown in Fig.4.
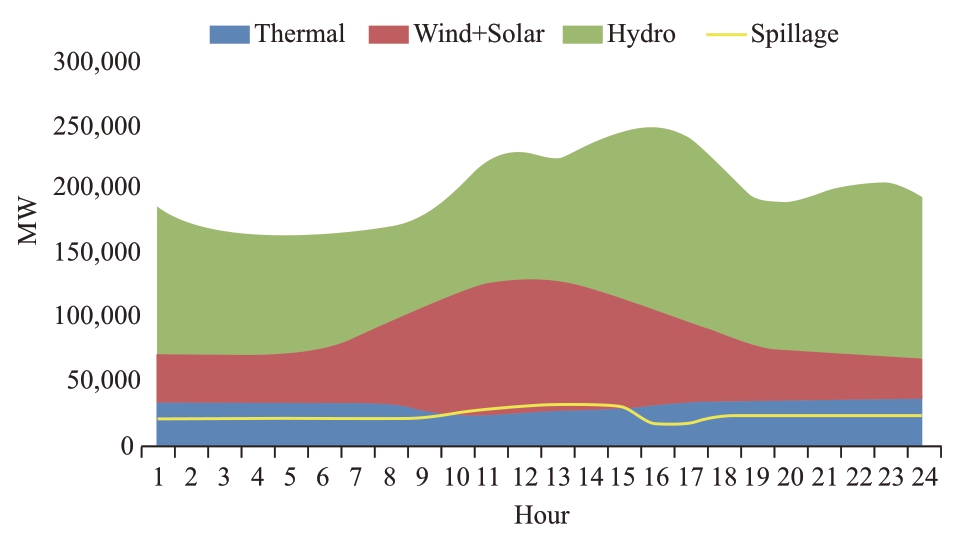
Fig.4 Stack chart for different types of generation
The cross-border transmission congestion is the key reason of hydro energy spillage.Based on the procedure of transmission upgrade optimization, the transmission capacity is increased gradually.The annualized cost per MW of transmission upgrade is supposed to be 12,000 $/MW, and the hydro generation price is supposed to be 28 $/MWh [20].Annual simulation is performed for each transmission capacity level and the cost-benefit index is calculated, see Table 2 and Fig.5.
Table 2 Cost-benefit analysis
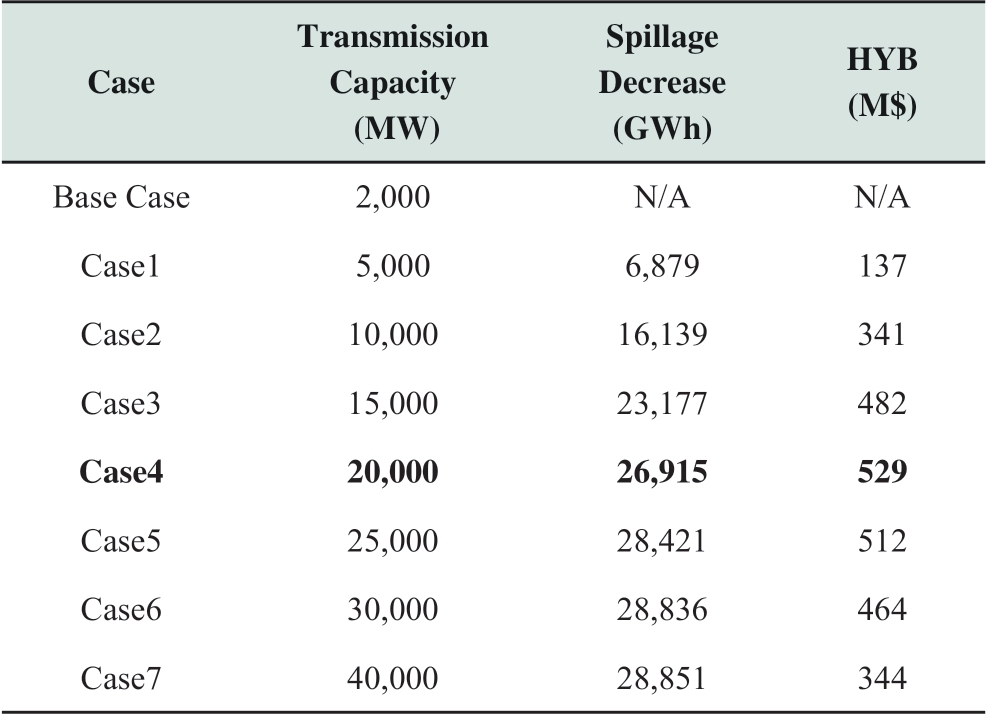
Based on the simulation result, amount of hydro energy spillage decreases with increase of transmission capacity between Brazil and Argentina.From 5,000 MW to 20,000 MW of the potential link, the rate of hydro energy spillage decrease is relatively high, since the major hydro needs to transfer between the two countries.However, when capacity of the link continuously increases, rate of spillage decrease is getting slower because transmission capacity redundancy shows up.Therefore, based on the HYB value, the optimal transmission capacity is 20,000 MW when HYB reaches the highest value of 529 M$.
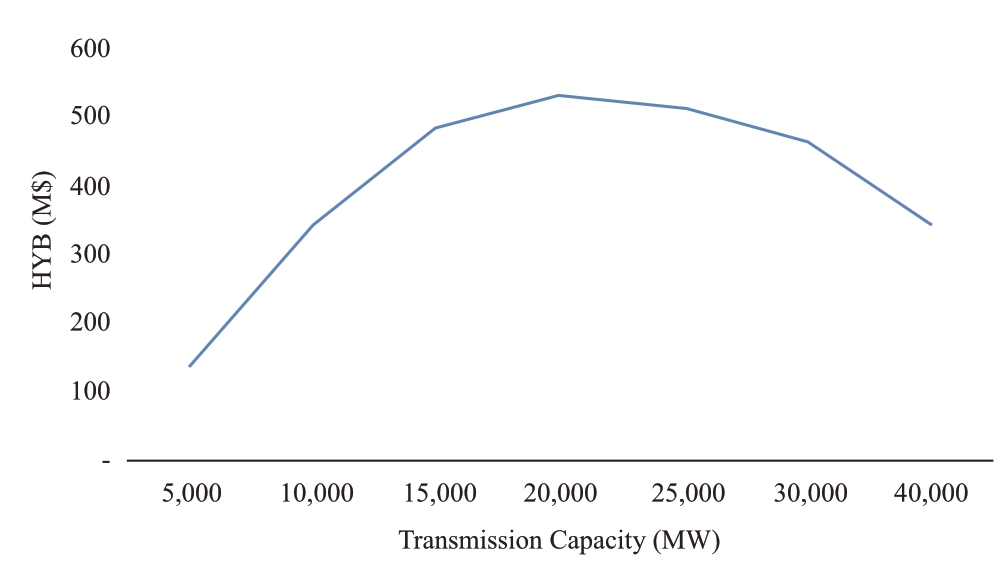
Fig.5 HYB with transmission capacity increase
The financial value of a merchant transmission line can be quantified after determination of the capacity.Fig.6 shows the chronological profile in blue and the duration profile in red for the yearly power flow of the transmission link.Percentage of power flow travelling from Brazil to Argentina and opposite direction to the transmission capacity are 33% and 67%, respectively.Transmission congestion happens only for 648 hours out of 8,760 hours.There are 80,958 GWh total energy transfer between Brazil and Argentina in the studied year.The capacity utilization rate of the link is 46%.Utilization rate and energy throughput are the key indices for a merchant transmission link since they mostly determine the expectation of the project financial income.
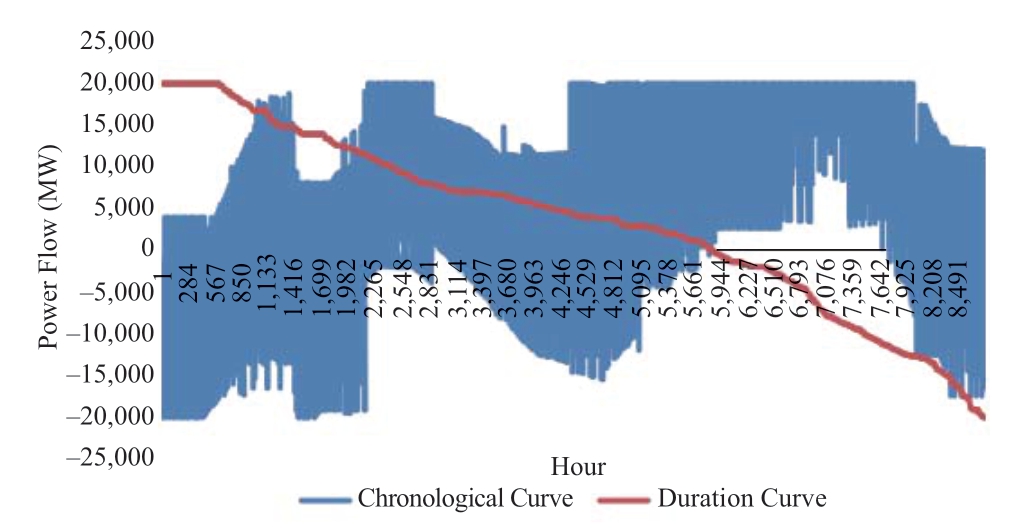
Fig.6 Power flow of the transmission link
5 Conclusions
The paper presents an economic assessment method for optimal planning of cross-border grid interconnection for power systems with rich hydro energy, using chronological production cost simulation to quantitatively evaluate the costs and financial benefits.The method is especially useful for the transmission congested regions which results in ineffective share of hydro energy between countries.During planning stage, using the method, merchant transmission entities can estimate financial indices, such as IRR and ROI for the cross-border transmission investment based on the tariff and energy flowing through the transmission links.The proposed planning method based on production cost simulation can be generally used for evaluating the benefit of upgrades of power system components, such as interconnection crossing different regions, flexibility enhancement to reduce wind or solar curtailment.For instance, when a congested transmission line from a wind farm is planned for upgrade due to heavy wind generation curtailment, the method can be used for comparing the wind generation curtailment before and after the upgrade to quantify its economic benefit.However, the proposed planning method is based on deterministic production cost simulation.Due to the stochastic characteristics of renewable generation, probabilistic modeling could be used in the future so that the expectation of benefit can be calculated.
Acknowledgements
This work was supported by Science and Technology Foundation of Global Energy Interconnection Group Co.Ltd (52450018000L).
References
[1] Zhenya L (2016) Research of global clean energy resource and power grid interconnection.Proceedings of the CSEE, 36(19):5103-5110, 5391
[2] Zhenya L (2015) Global Energy Internet.China Electric Power Press, Beijing
[3] Voropai N, Podkovalnikov S, Osintsev K (2018) From interconnections of local electric power systems to Global Energy Interconnection.Global Energy Interconnection.1(1): 4-10
[4] Shen H, Dai Q, Wu Q, Wu J, Zhou Q, Wang J, Yang W, Pestana R, Pastor R (2018) The state-of-the-arts of the study on grid interconnection between Iberian Peninsula and West Maghreb region.Global Energy Interconnection, 1(1): 20-28
[5] Zhou Y, Chen X, Tan X, Liu C, Zhang S, Yang F, Zhou W, Huang H (2018) Mechanism of CO2 Emission Reduction by Global Energy Interconnection.Global Energy Interconnection, 1(4): 409-419
[6] Wang M, Kang W, Chen Z, Zhang Y, Liu C, Yang F (2018) Global Energy Interconnection: an innovative solution for implementing the Paris Agreement - the significance and pathway of integrating GEI into global climate governance.Global Energy Interconnection, 1(4): 467-476
[7] Wang C, Dargaville D, Jeppesen M (2018) Power system decarbonisation with Global Energy Interconnection - a case study on the economic viability of international transmission network in Australasia.Global Energy Interconnection, 1(4): 507-519
[8] Latin American Energy Organization (2016) Energy Economic Information System-Energy Statistics
[9] G.Latorre, R.D.Cruz, J.M.Areiza, A.Villegas (2003) Classification of publications and models on transmission expansion planning.IEEE Transactions on Power Systems.18(2): 938-946
[10] N.Alguacil, A.L.Motto, A.J.Conejo (2003) Transmission expansion planning: a mixed-integer LP approach.IEEE Transactions on Power Systems.18(3): 1070-1077
[11] R.Romero, R.A.Gallego, A.Monticelli (1996) Transmission system expansion planning by simulated annealing.Global Energy Interconnection.11(1): 364-369
[12] M.O.Buygi, G.Balzer, H.M.Shanechi, M.Shahidehpour (1996) Market-based transmission expansion planning.IEEE Transactions on Power Systems.19(4): 2060-2067
[13] Zongxiang L, Hao L, Ying Q.(2018) Wide-area interconnection grid planning for clean power integration considering the effect of country risks.Journal of Global Energy Interconnection, 1(01): 23-31
[14] Bingqi J, Fuqiang Z, Zhicheng X.(2019) Multi-period planning model of power flow of global energy interconnection based on time series scenarios.Journal of Global Energy Interconnection, 2(01):8-15
[15] Jinyu X, Yu Z, Lei W, Huiling L.(2018) Application of DC grid in global energy interconnection and case study.Journal of Global Energy Interconnection, 1(1): 32-38
[16] Alexandre Moreira, David Pozo, Alexandre Stree, etc.(2016) Reliable Renewable Generation and Transmission Expansion Planning: Co-Optimizing System’s Resources for Meeting Renewable Targets.IEEE Transactions on Power Systems.32(4): 3246-3257
[17] Ali Bagheri, Chaoyue Zhao, Feng Qiu, etc.(2018) Resilient Transmission Hardening Planning in a High Renewable Penetration Era.IEEE Transactions on Power Systems.34(2): 873-882
[18] N.P.Padhy.(2004) Unit commitment-a bibliographical survey.IEEE Transactions on Power Systems, 19(2): 1196-1205
[19] Basin Data Explorer.http://grdc.sr.unh.edu/html/stn.html
[20] IRENA (2017) Planning for the Renewable Future-long-term modelling and tools to expand variable renewable power in emerging economies


Scan for more details
Received: 31 August 2019/ Accepted: 9 October 2019/ Published: 25 February 2020
 Caihao Liang
caihao-liang@geidco.org
Jing Meng
meng-jing@geidco.org
Yuanbing Zhou
yuanbing-zhou@geidco.org
Chen Chen
c-chen@geidco.org
2096-5117/© 2020 Global Energy Interconnection Development and Cooperation Organization.Production and hosting by Elsevier B.V.on behalf of KeAi Communications Co., Ltd.This is an open access article under the CC BY-NC-ND license (http: //creativecommons.org/licenses/by-nc-nd/4.0/ ).
Biographies
Caihao Liang received PhD degree in Electrical Engineering at Huazhong University of Science and Technology, China, 2006.He is now working in GEIDCO as the deputy director of the Electric Power Planning Research Division.His research interests include intelligent optimization algorithms, power system planning and analysis, and renewable energy.
Jing Meng received M.S.degree at Chongqing University in 2008 and B.E.degree in Beijing Jiaotong University, China, 2005.She is now working in GEIDCO as a research fellow.Her research interests include power system planning and renewable energy.
Chen Chen received PhD degree in Electrical Engineering at Xi’an Jiaotong University, China, 2018.He is now working in GEIDCO as a research fellow.His research interests include power system planning and renewable energy.
Yuanbing Zhou is the Director of Economic & Technology Research Institute at the Global Energy Interconnection Development and Cooperation Organization (GEIDCO), special allowance expert of the State Council, Director of China Renewable Energy Association, and member of the Expert Committee of the Think Tank Alliance of the SOEs.His research interests and experiences are related to energy and electricity strategy and master-plan, energy policy, clean energy and smart grid, energy interconnection etc.
(Editior Dawei Wang)
